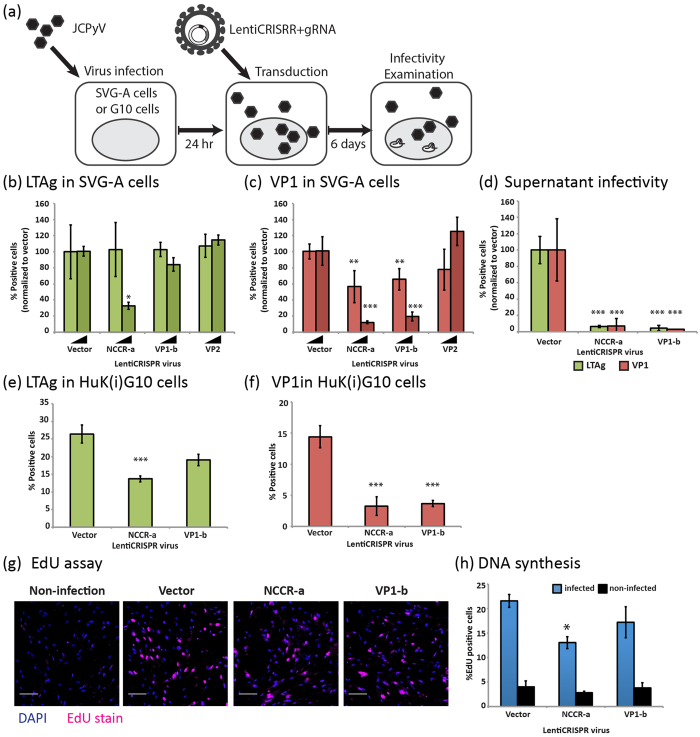
Figure 5. JCPyV specific CRISPR-Cas9 system inhibited established JCPyV infection.
(a) Experimental scheme. SVG-A cells or HuK(i)G10 cells were infected with JCPyV-MAD1 for 24 hours and then were transduced with LentiCRISPR/gRNA viruses expressing different gRNAs. The level of virus infection was examined at day 6 post-infection. (b,c) Infected SVG-A cells were transduced with two different doses of LentiCRISPR/gRNA viruses, the percentages of (b) LTAg cells and (c) VP1 positive cells are shown. The inoculated genome copies concentration ratio of JCPyV-MAD1 and LentiCRISPR/gRNA virus were 10:1 and 40:1. The inoculation dose of JCPyV-MAD1 was 5 × 10⁷ genome copies/ml. (d) SVG-A cells were infected with supernatant collected from JCPyV-MAD1 infected cells transduced with LentiCRISPR/gRNA viruses (genome copy concentration ratio of JCPyV-MAD1: LentiCRISPR/gRNA = 10:1) for 6 days. The Quantification of the percentages of LTAg, VP1 positive SVGA cells are shown. ***One-way ANOVA, p value < 0.001. N = 2 (e,f) HuK(i)G10 cells were infected with JCPyV-MAD1 as illustrated in (a), the percentages of (e) LTAg and (f) VP1 positive cells are shown. ***One-way ANOVA, p value < 0.001. (g,h) DNA replication efficiency of the JCPyV virus genome is measured using EdU assay. (g) Fluorescent images of virus infected cells after Click-iT reactions are shown. Scale bar = 50 μm (h) Quantification of the percentages of EdU positive cells are shown for infected and non-infected cells. Non-infected HuK(i)G10 was included in the assay as a control indicating the background signal of EdU assay due to cellular DNA replication. *t-test, p value < 0.05.

