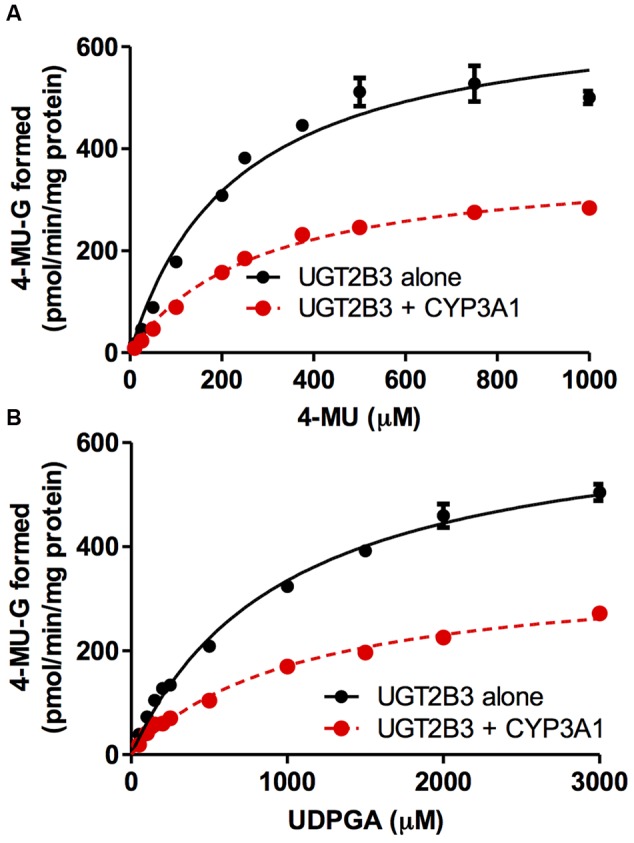
FIGURE 2.

Michaelis-Menten plots of 4-MU glucuronidation catalyzed by UGT2B3 in the absence and presence of CYP3A1 co-expression. The plots of UGT2B3 single- and UGT2B3-CYP3A1-dual are shown. The kinetics obtained by varying the 4-MU concentration (A) and UDPGA concentration (B) are shown. In (A), the 4-MU concentration was varied over the range 10-1000 μM while the UDPGA concentration was fixed at 2 mM. In (B), the UDPGA concentration was varied over the range 50 μM–3 mM while the 4-MU concentration was fixed at 1 mM. The total amount of protein added to the assay mixture was standardized at 100 μg. For this, when necessary, control baculosomes were added to the reaction mixture. Kinetic parameters were calculated by fitting the curve to a Michaelis-Menten equation, and they are listed in Table 1.
