
FIGURE 6.
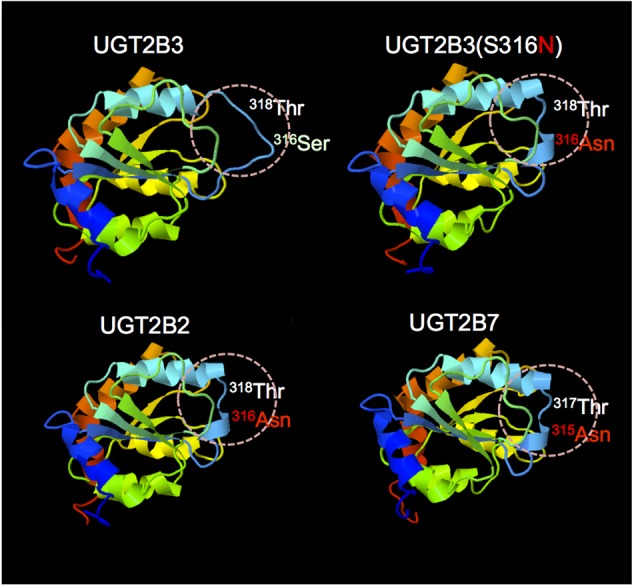
Comparison of the predicted structure of UGT2B3 wild-type, UGT2B3(S316N), UGT2B2, and UGT2B7: the region spanning from 285 to 450. The models were constructed using the Phyre2 web server (Kelley et al., 2015) with the UGT2B7 (amino acid residue from 285 to 450) as a template. Template: UGT2B7, Miley et al. (2007) (DOI: 10.2210/pdb2o6l/pdb).