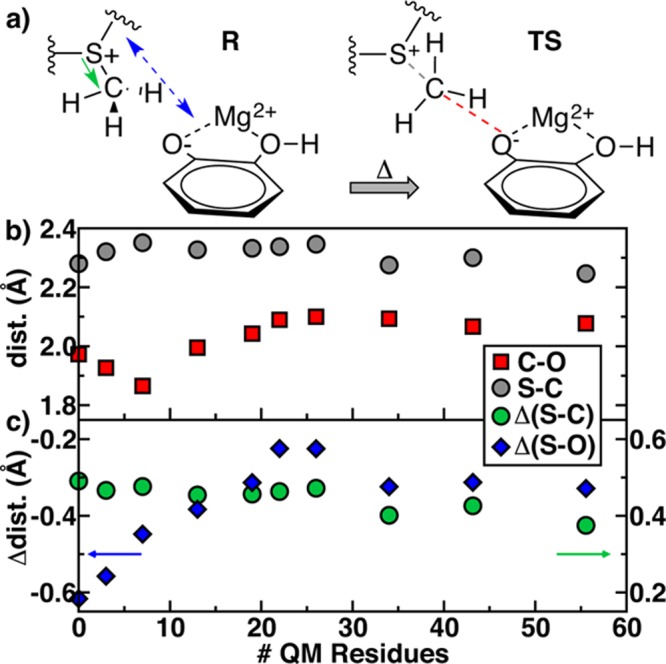
Figure 6.

Enzyme–substrate complex reactant (R) and transition state (TS) structures annotated with TS–R Δ(S–C) distance and TS–R Δ(S–O) distance (left) and S–C or C–O distance (right). (b) S–C (gray circles) and C–O (red squares) distances with QM region size. (c) TS–R Δ(S–C) distance (green circles) and TS–R Δ(S–O) distance (blue diamonds) with QM region size.
