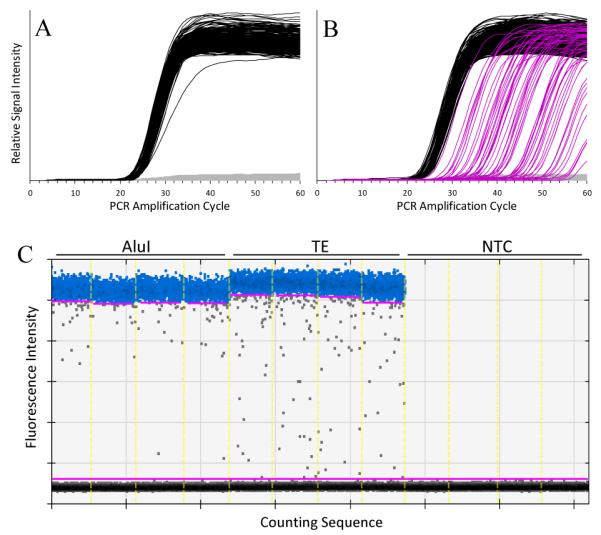
Figure 2.

Panels A and B display the relative fluorescence intensity of 48.770 cdPCR chambers as functions of PCR amplification cycle for four panels each of AluI-cut and TE control NIST1 DNA amplified with the Quantifiler assay. The grey curves depict the background fluorescence of chambers where there was no target amplification. The black curves depict fluorescence intensity in “normal” chambers. The magenta curves depict the signal intensity for “late-start” chambers. Panel C displays the ddPCR droplet fluorescence intensities for four wells each of AluI-cut, TE control, and non-template controls (NTC) after 40 amplification cycles of the Quantifiler assay. The horizontal axis represents the droplet counting sequence. The light yellow vertical lines mark the well-boundaries. The lower and upper magenta horizontal lines represent two intensity threshold choices. The grey dots between these lines represent droplet “rain”.
