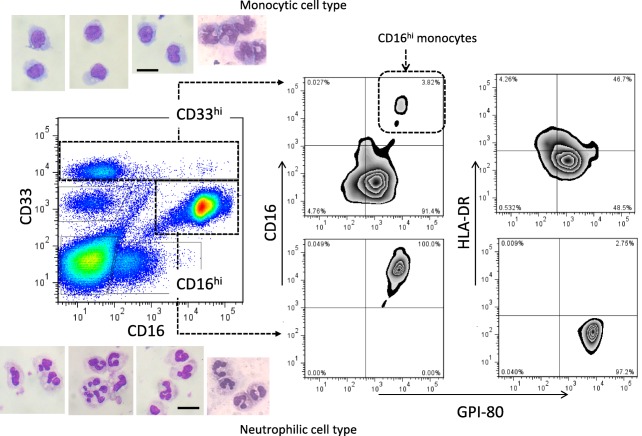
Figure 3.

Representative analysis of the myeloid cell population in human peripheral blood. Whole blood cells were stained with CD33, CD16, human leucocyte antigen D‐related (HLA‐DR) and glycosylphosphatidylinositol‐anchored 80 kD protein (GPI‐80). The population of CD33hi (monocytic cell type, upper side) or CD16hi (neutrophilic cell type, lower side) were sorted, and then stained with May–Giemsa as shown in each respective photograph. The photographs are representative of four independent experiments. Bar = 10 μm. The expression of CD16 (middle panels) and HLA‐DR (right side panels) was compared to that of GPI‐80 in the CD33hi and CD16hi cell population. [Colour figure can be viewed at wileyonlinelibrary.com]
