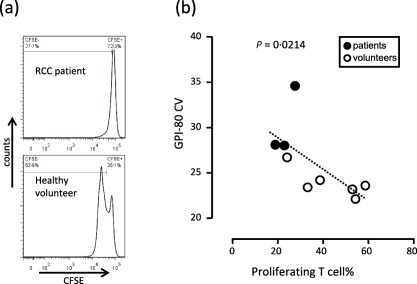
Figure 6.

Inverse correlation between glycosylphosphatidylinositol‐anchored 80 kD protein (GPI‐80)+ coefficient of variation (CV) and T cell proliferation. (a) Representative histograms of carboxyfluorescein diacetate succinimidyl ester (CFSE)‐labelled CD3+ T cell proliferation assay, analysed by flow cytometry, are shown. The upper panel is the result from patients and the lower panel is from healthy volunteers. (b) GPI‐80 CV in CD16hi population in peripheral blood was measured (vertical axis) and CFSE‐labelled T cells were incubated with autologous polymorphonuclear leucocytes [polymorphonuclear cells (PMN), mainly CD16hi population]; the ratio of T cells to PMN was adjusted to 1 : 1. After incubation, the percentage of proliferating T cells was measured (horizontal axis). The results from the patients are indicated as closed circles and the results from healthy volunteers are shown as open circles.
