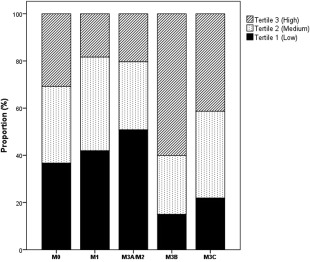
Figure 2.

Proportion of study participants with low (tertile 1), medium (tertile 2) or high (Tertile 3) levels of plasma proneurotensin according to Marsh category. The tertiles were created by dividing proneurotensin levels from all study participants into three equally sized groups. M0 = normal mucosa (n = 74); M1 = lymphocyte infiltration (n = 36); M2/M3a = lymphocyte infiltration, crypt hyperplasia and partial villous atrophy (n = 20); M3b = lymphocyte infiltration, crypt hyperplasia and subtotal villous atrophy (n = 21); M3c = lymphocyte infiltration, crypt hyperplasia and total villous atrophy (n = 35).
