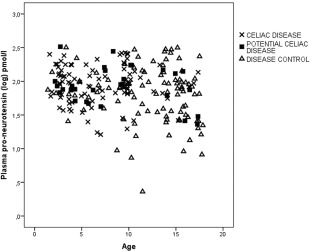
Figure 4.

Correlation between proneurotensin (log) and age (years) for coeliac disease patients r 2 = −0·054; P = 0·61 (cross), potential coeliac disease patients r 2 = −0·069; P = 0·72 (filled square) and disease controls r 2 = −0·17; P = 0·096 (triangle), calculated using Spearman's rank test.
