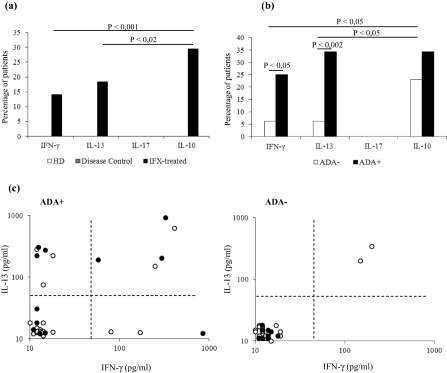
Figure 3.

Cytokine profile of the infliximab (IFX)‐specific T cells. (a) Cytokine production in the culture supernatants of the IFX‐treated patients and control groups upon IFX stimulation. Data are expressed as mean values ± standard error (s.e.). (b) IFX‐driven cytokine production by anti‐drug antibody (ADA)+ and ADA– IFX‐treated patients. Data are expressed as mean values ± s.e. (c) Interleukin (IL)‐10 production (black dots) by IL‐13 and interferon (IFN)‐γ‐producing cultures in ADA+ and ADA– patients. Each dot represents an individual subject.
