Figure 3.

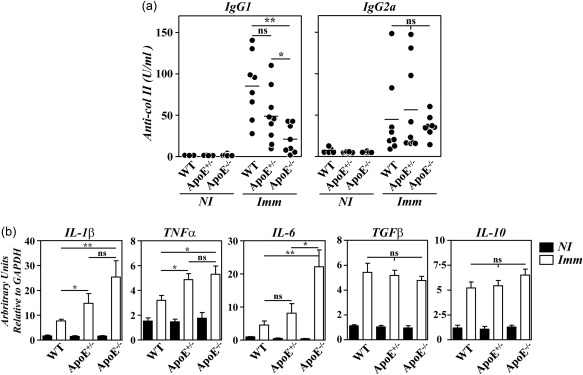
Anti‐collagen type II (col II) humoral responses and cytokine gene expression in apolipoprotein E (ApoE) mutant mice. (a) Serum levels of immunoglobulin (Ig)G1 and IgG2a anti‐col II antibodies in individual mice before (NI) and 4 weeks after (Imm) immunization with col II. Bars represent the mean values. Results are representative of two independent experiments. (b) Analysis by reverse transcription–quantitative polymerase chain reaction (RT–qPCR) of interleukin (IL)‐1β, tumour necrosis factor (TNF)‐α and IL‐6 gene expression in the paws of B10.RIII.wild‐type (WT), B10.RIII.ApoE +/– and B10.RIII.ApoE –/– mice before (NI; closed bars) and 8 weeks after (Imm; open bars) immunization with col II. Representative results from one of three independent experiments (six to eight animals/group) are expressed as the mean ± standard deviation fold change of each cytokine relative to glyceraldehyde 3‐phosphate dehydrogenase (GAPDH) expression measured in parallel in each sample. Statistical differences are indicated as follows: n.s. = non‐significant; *P < 0·05; **P < 0·01.
