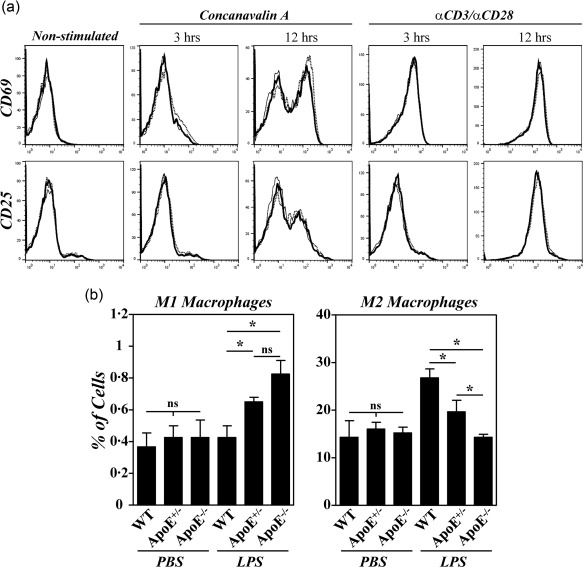
Figure 4.

Effects of apolipoprotein E (ApoE) deficiency on the activation of CD4+ cells and in M1/M2 macrophage polarization. (a) Spleen cells from B10.RIII.wild‐type (WT), B10.RIII.ApoE +/– and B10.RIII.ApoE –/– mice were stimulated in vitro with concanavalin A or with αCD3/αCD28, and the kinetics of CD69 and CD25 induction was analysed by flow cytometry 3 and 12 h afterwards. Results are expressed as overlapping representative histograms of B10.RIII.WT (thin line), B10.RIII.ApoE +/– (dotted line) and B10.RIII.ApoE –/– (thick line) mice in one of two independent experiments. (b) B10.RIII.WT, B10.RIII.ApoE +/– and B10.RIII.ApoE –/– mice were injected with phosphate‐buffered saline (PBS) or lipopolysaccharide (LPS) and the percentages of M1 and M2 macrophages in the peritoneal cavity analysed by flow cytometry 48 h later. Representative results of two independent experiments are expressed as the mean ± standard deviation (three to four animals/group). Statistical differences are indicated as follows: n.s. = non‐significant; *P < 0·05.
