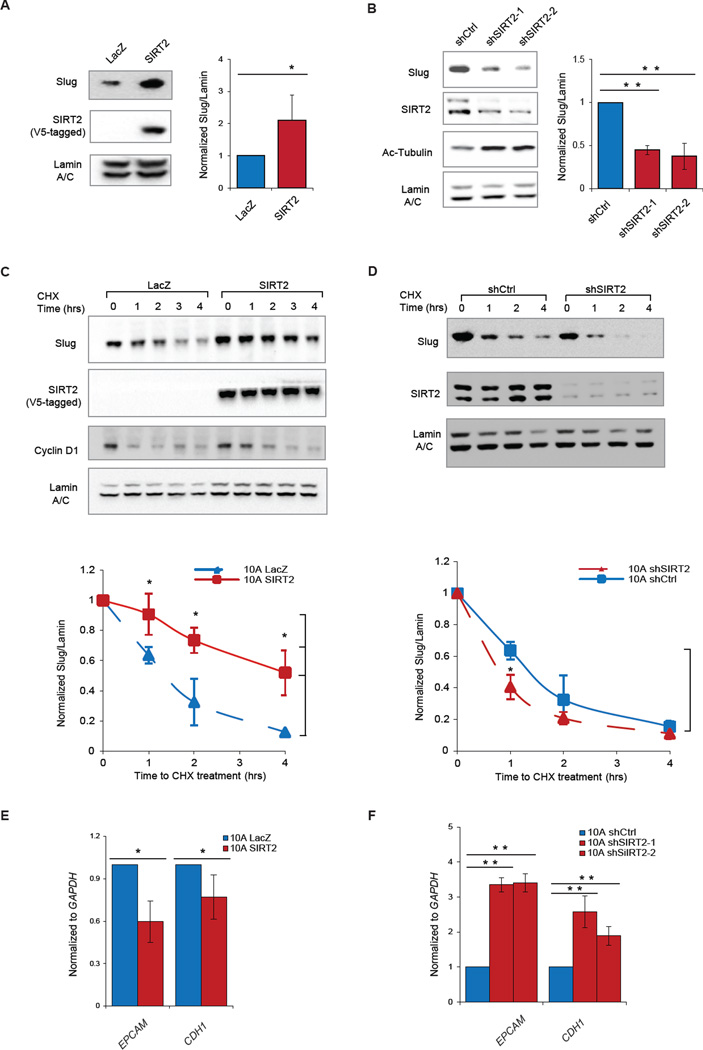
Figure 2. SIRT2 regulates Slug protein abundance and activity.
(A) (Left) Immunoblots showing levels of Slug, V5 tagged SIRT2 (SIRT2-V5) and Lamin A/C in MCF10A cells ectopically expressing SIRT2-V5 or control lacZ. (Right) Quantification of relative Slug levels from five independent experiments, normalized to Lamin A/C. Data are shown as mean ± SEM. * p < 0.05.
(B) (Left) Immunoblots showing levels of Slug, SIRT2, acetylated tubulin (a bona fide SIRT2 substrate) and Lamin A/C in MCF10A cells expressing two different hairpins targeting SIRT2. (Right) Quantification of relative Slug levels from three independent experiments, normalized to Lamin A/C. Data are shown as mean ± SEM. ** p < 0.01.
(C) (Top) Immunoblots showing levels of Slug, SIRT2-V5, Cyclin D1 and Lamin A/C in CHX-treated MCF10A cells overexpressing SIRT2-V5 or control LacZ. (Bottom) Quantification of relative Slug levels from three independent experiments, normalized to Lamin A/C. Data are shown as mean ± SEM. * p < 0.05.
(D) (Top) Immunoblot showing levels of Slug, SIRT2-V5 and Lamin A/C in CHX-treated MCF10A cells expressing either shSIRT2 or a non-silencing shRNA control (shCtrl). (Bottom) Quantification of relative Slug levels from three independent experiments, normalized to Lamin A/C. Data are shown as mean ± SEM. * p < 0.05.
(E) Expression of Slug target genes EPCAM and CDH1 in MCF10A cells overexpressing SIRT2 or LacZ (n = 3) as determined by qRT-PCR. Data are shown as mean ± SEM. * p < 0.05.
(F) Expression of Slug target genes EPCAM and CDH1 in MCF10A cells expressing shSIRT2 or shCtrl (n = 3) as determined by qRT-PCR. Data are shown as mean ± SEM. ** p < 0.01.

