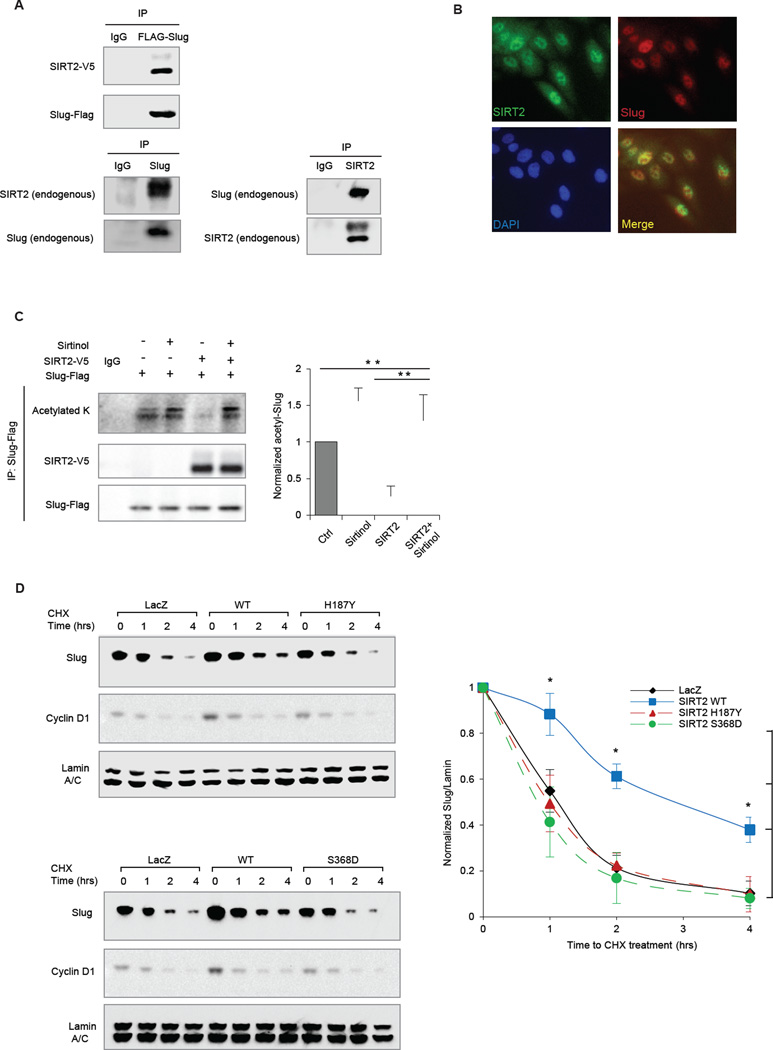
Figure 3. SIRT2 binds to and deacetylates Slug.
(A) (Top) Lysates from HEK293T cells transfected with Flag-tagged Slug (Flag-Slug) and V5-tagged SIRT2 (SIRT2-V5) were subjected to anti-Flag immunoprecipitation. Immunoblots of Flag-Slug and SIRT2-V5 are shown. (Bottom) Lysates from MCF10A were subjected to anti-Slug immunoprecipitation (left) and anti-SIRT2 immunoprecipitation (right). Immunoblots of endogenous Slug and SIRT2 are shown.
(B) Immunofluorescence of Slug (Red) and SIRT2 (Green) in MCF10A cells. DAPI (Blue) was used to visualize nuclei.
(C) (Left) Anti-Flag immunoprecipitation of lysates from HEK293T cells, overexpressing Flag-Slug and/or SIRT2-V5, and treated with sirtinol or vehicle control were immunoblotted for panacetylated lysine, Flag-Slug and SIRT2-V5. (Right) Relative levels of acetylated Slug protein from three independent experiments, normalized to immunoprecipitated Flag-Slug. Data are shown as mean ± SEM. ** p < 0.01.
(D) (Left) Immunoblots showing levels of Slug, Cyclin D1 and Lamin A/C in CHX-treated MCF10A cells expressing control LacZ, wild-type SIRT2 or catalytically inactive SIRT2 mutants H187Y (top) and S368D (bottom). (Right) The degradation curves of relative Slug protein from three independent experiments are normalized to Lamin A/C and plotted for cells overexpressing LacZ (black), wild-type SIRT2 (blue), or SIRT2 mutants H187Y and S368D (red and green, respectively). Data shown are mean ± SEM. * p < 0.05.

