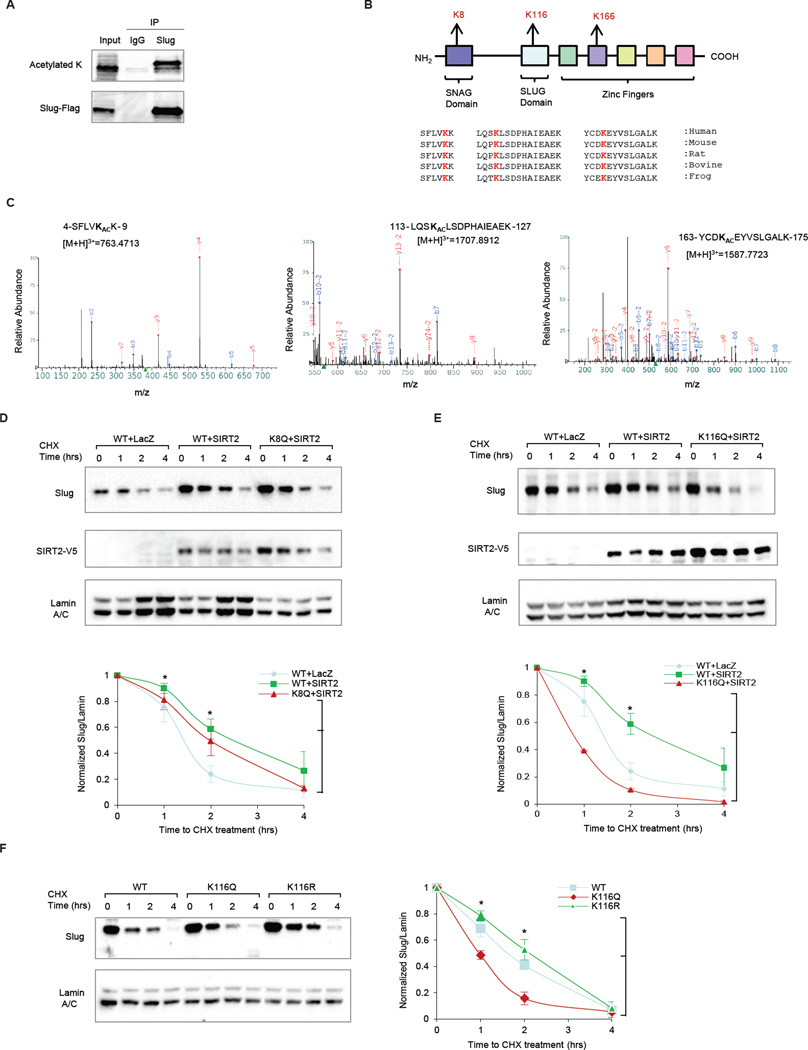
Figure 4. Identification of K116 as an acetylated Slug substrate of SIRT2.
(A) Anti-FLAG immunoprecipitation of HEK293T cells overexpressing FLAG-Slug, followed by pan-acetylated lysine blotting detects acetylated Slug, which was digested and analyzed by mass-spectrometry.
(B) Schematic summarizes the three identified acetylated residues in relationship to functional domains of Slug. Sequence alignment analysis shows that all three acetylated residues are highly conserved across different species.
(C) LC/MS/MS spectrums are displayed for each of the three acetylated Slug residues.
(D) (Top) Immunoblots comparing the effect of SIRT2 overexpression on wild-type (WT) Slug versus an acetylation-mimic K8Q Slug mutant in MCF10A cells. Immunoblot of SIRT2-V5 is included to show SIRT2 overexpression. (Bottom) The degradation curves of relative Slug protein from three independent experiments are normalized to Lamin A/C and plotted for cells overexpressing WT Slug + LacZ control (blue), WT Slug + SIRT2 (green), and K8Q Slug mutant + SIRT2 (red). Data shown are mean ± SEM. * p < 0.05.
(E) (Top) Immunoblots comparing the effect of SIRT2 overexpression in WT versus an acetylation-mimic K116Q Slug mutant in MCF10A cells. Immunoblot of V5-SIRT2 is included to show SIRT2 overexpression. (Bottom) The degradation curves of relative Slug protein from three independent experiments are normalized to Lamin A/C and plotted for cells overexpressing WT Slug + LacZ control (blue), WT Slug + SIRT2 (green), and K116Q Slug mutant + SIRT2 (red). Data shown are mean ± SEM. * p < 0.05.
(F) (Left) Immunoblots showing the stability of the acetylation-mimic K116Q Slug mutant and the acetylation-resistant K116R Slug mutant in MCF10A cells. (Right) The degradation curves of relative Slug protein from three independent experiments are normalized to Lamin A/C and plotted for cells overexpressing WT Slug (blue), K116R Slug mutant (green), and K116Q Slug mutant (red). Data shown are mean ± SEM. * p < 0.05.

