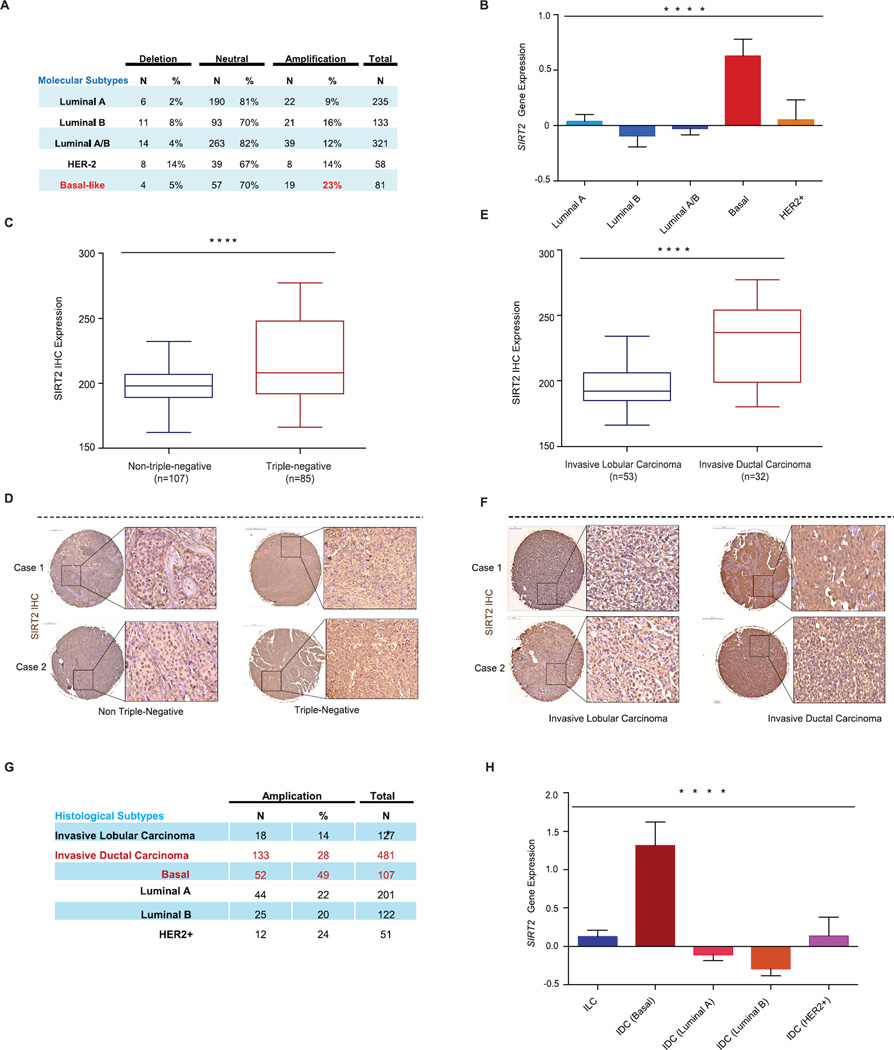
Figure 5. SIRT2 expression is elevated in BLBCs.
(A) SIRT2 somatic copy number analysis by TCGA across the molecular subtypes of breast cancer. Data were analyzed using two-tailed unpaired student’s t-tests, p-values for basal vs luminal A=0.011, basal vs. luminal B=0.031, basal vs. Luminal A/B=0.488, basal vs. HER2+=0.040.
(B) SIRT2 gene expression across the molecular subtypes of breast cancer from the TCGA data set. Data were analyzed using one-way ANOVA, Data shown are mean ± SEM. **** p<0.0001.
(C) Immunohistochemical analysis of SIRT2 protein expression in tissue microarrays containing 192 breast tumor samples. Shown is the comparison of SIRT2 expression between triplenegative and non-triple-negative breast cancer cases. Data were analyzed using two-tailed unpaired student’s t-test. **** p < 0.0001.
(D) Representative SIRT2 immunohistochemical staining from triple-negative and non-triple-negative breast cancer cases are shown.
(E) Triple-negative (TN) cases were further stratified by histological classification, and shown is the comparison of SIRT2 expression between TN-invasive lobular carcinoma and TN-invasive ductal carcinoma. Data were analyzed using two-tailed unpaired student’s t-test. **** p<0.0001.
(F) Representative SIRT2 immunohistochemical staining from TN-invasive lobular carcinoma and TN-invasive ductal carcinoma are shown.
(G) SIRT2 somatic copy number analysis by TCGA in invasive lobular carcinoma (ILCs) and invasive ductal carcinoma (IDCs) subclasses. Data were analyzed using two-tailed unpaired student’s t-tests, p-values for: ILC vs. IDC (basal) =0.001, ILC vs. IDC (luminal A) =0.001, ILC vs. IDC (luminal B) =2.72 × 10⁻⁶, ILC vs. IDC (HER2+) =0.001.
(H) SIRT2 gene expression from the TCGA data set for the invasive lobular carcinoma (ILCs) and invasive ductal carcinoma (IDCs) subclasses. Data were analyzed using one-way ANOVA, Data shown are mean ± SEM. **** p<0.0001.

