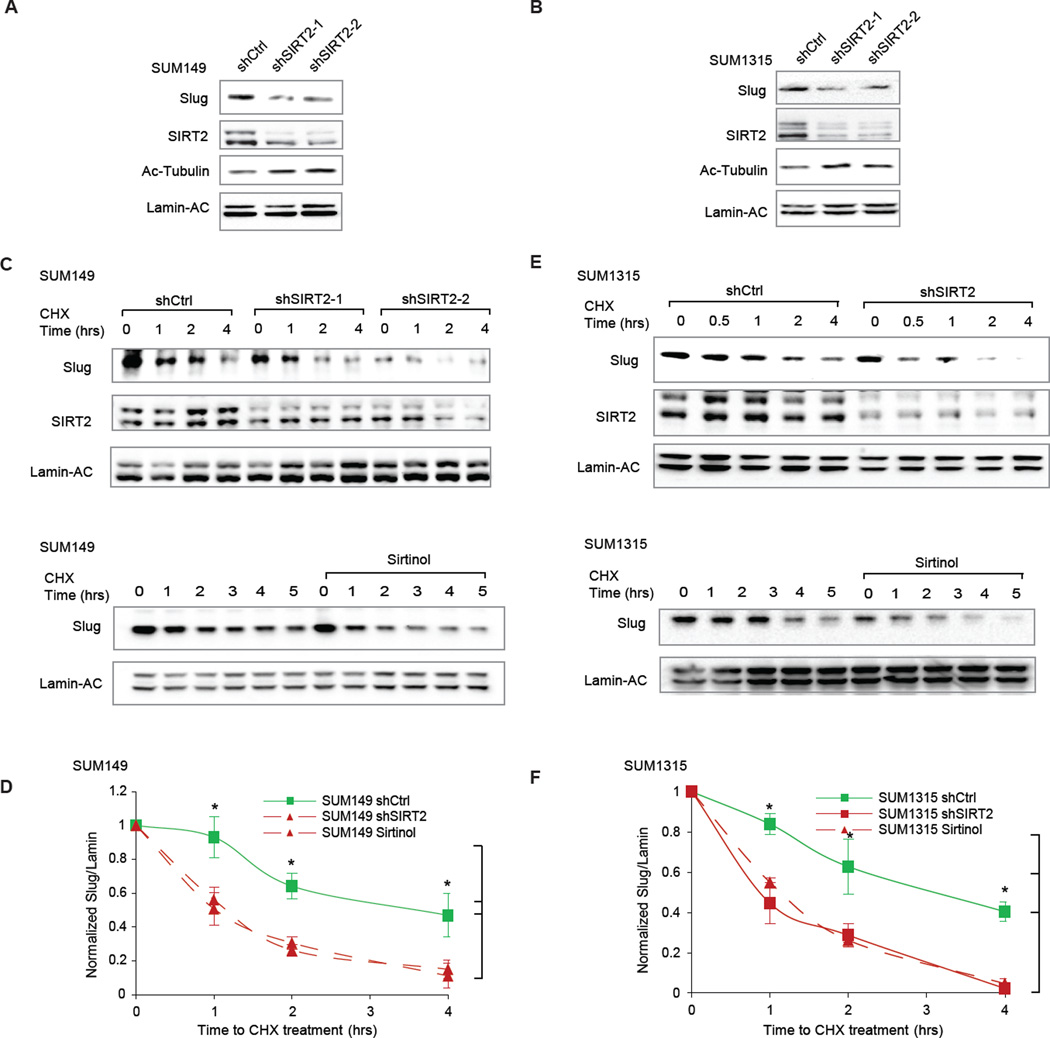
Figure 6. SIRT2 is required for Slug stability in BLBCs.
(A) Immunoblots showing the effect of SIRT2 knockdown on Slug protein abundance in SUM149 BLBC cells, compared to a non-targeting hairpin control (shCtrl). Acetylated-tubulin levels are also shown to assess SIRT2 deacetylation activity.
(B) Immunoblots showing the effect of SIRT2 knockdown on Slug protein abundance in SUM1315 BLBC cells, compared to a non-targeting hairpin control (shCtrl). Acetylated-tubulin levels are also shown to assess SIRT2 deacetylation activity.
(C) (Top) Immunoblots showing Slug degradation in SIRT2-depleted SUM149 cells, compared to a non-targeting hairpin control (shCtrl). (Bottom) Immunoblots showing the effect of SIRT2 inhibition by sirtinol on Slug degradation in SUM149 cells, compared to DMSO vehicle treatment.
(D) Quantification from three separate experiments shows the effect of genetic silencing or pharmacological inhibition of SIRT2 in SUM149 cells. Data shown are mean ± SEM. * p < 0.05.
(E) (Top) Immunoblots showing Slug degradation in SIRT2-depleted SUM1315 cells, compared to a non-targeting hairpin control (shCtrl). (Bottom) Immunoblots showing the effect of SIRT2 inhibition by sirtinol on Slug degradation in SUM1315 cells, compared to DMSO vehicle treatment.
(F) Quantification from three separate experiments shows the effect of genetic silencing or pharmacological inhibition of SIRT2 in SUM1315 cells. Data shown are mean ± SEM. * p < 0.05.

