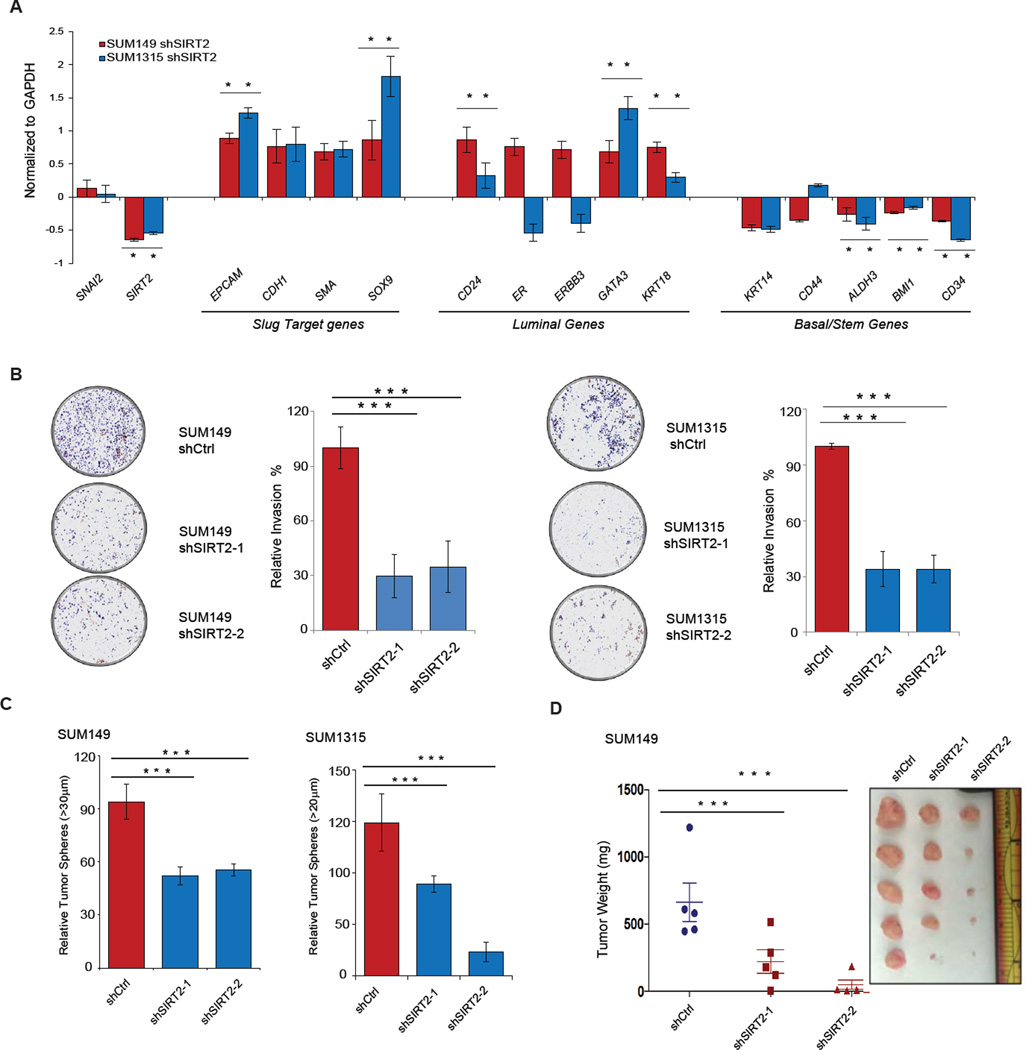
Figure 7. Silencing SIRT2 causes the loss of aggressive BLBC features in cancer cells.
(A) qRT-PCR analysis of expression levels of Slug target genes as well as luminal and basal differentiation markers following SIRT2 silencing in SUM149 (red) and SUM1315 (blue) BLBCs. Genes differentially expressed are represented as a log2 fold change over the non-targeting shCtrl cell lines. Data shown are mean ± SEM. * p < 0.05.
(B) (Left) Representative images showing the effect of SIRT2 silencing on the invasive capacity of SUM149 and SUM1315 cancer cells, compared to non-targeting hairpin control (shCtrl). (Right) The total number of cells invading through the Matrigel coated transwell were quantified (n = 3 per cell line). Data are shown as mean ± SEM. *** p < 0.001
(C) Tumor sphere-forming ability of SUM149 and SUM1315 cells following SIRT2 depletion, compared to a non-targeting hairpin control (shCtrl). Quantification is from three independent experiments. Data are shown as mean ± SEM. *** p < 0.001.
(D) Quantification of tumor mass (left panel) and photograph (right panel) of SUM149 cells grown as orthotopic xenografts in NOD/SCID mice. Tumors with two different hairpins targeting SIRT2 or a non-targeting hairpin control (shCtrl) are indicated. Data are plotted as individual data points from the five animals of each group. The mean ± SEM are shown, and comparisons between groups were performed using two tailed Student’s t-tests. *** p < 0.001.

