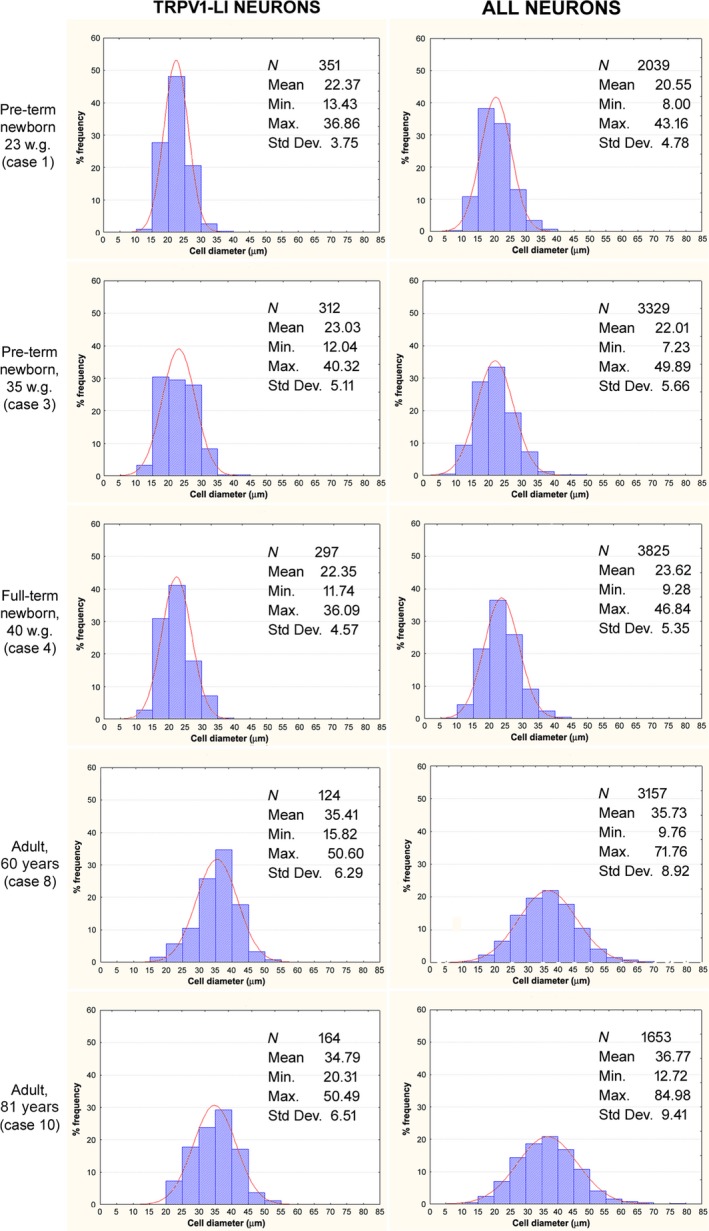
Figure 3.

Human trigeminal ganglion. Size frequency histograms of TRPV1‐LI neurons (left column) and all neurons (right column) detected in the same TG sections of specimens from two pre‐term newborns (cases 1 and 3), one full‐term newborn (case 4), and two adults (cases 8 and 10). X‐axis values represent the mean cell diameters expressed in μm; Y‐axis reports values of relative percent frequency. Curves superimposed on the histograms represent the theoretical normal distribution.
