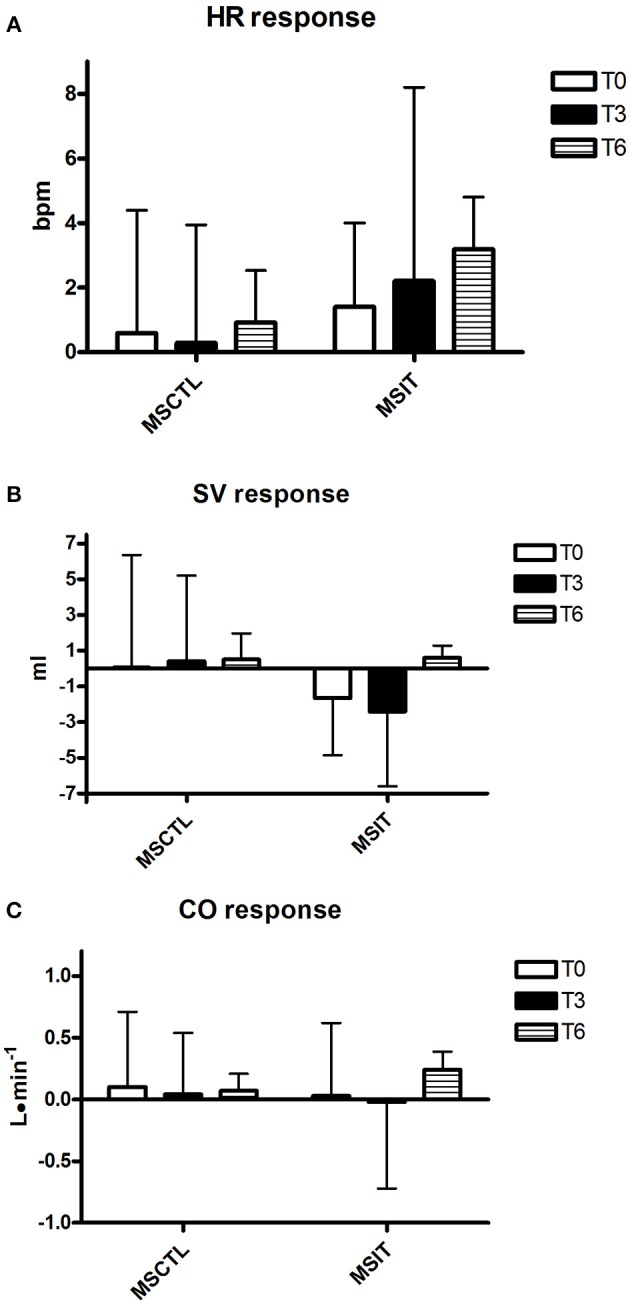
Figure 2.

Responses due to metaboreflex activation in HR (A), SV (B), and CO (C) at T0, T3, and T6, respectively. Groups are the MSCTL (n = 10) and the MSIT (n = 11). Values are mean ± SD.

Responses due to metaboreflex activation in HR (A), SV (B), and CO (C) at T0, T3, and T6, respectively. Groups are the MSCTL (n = 10) and the MSIT (n = 11). Values are mean ± SD.