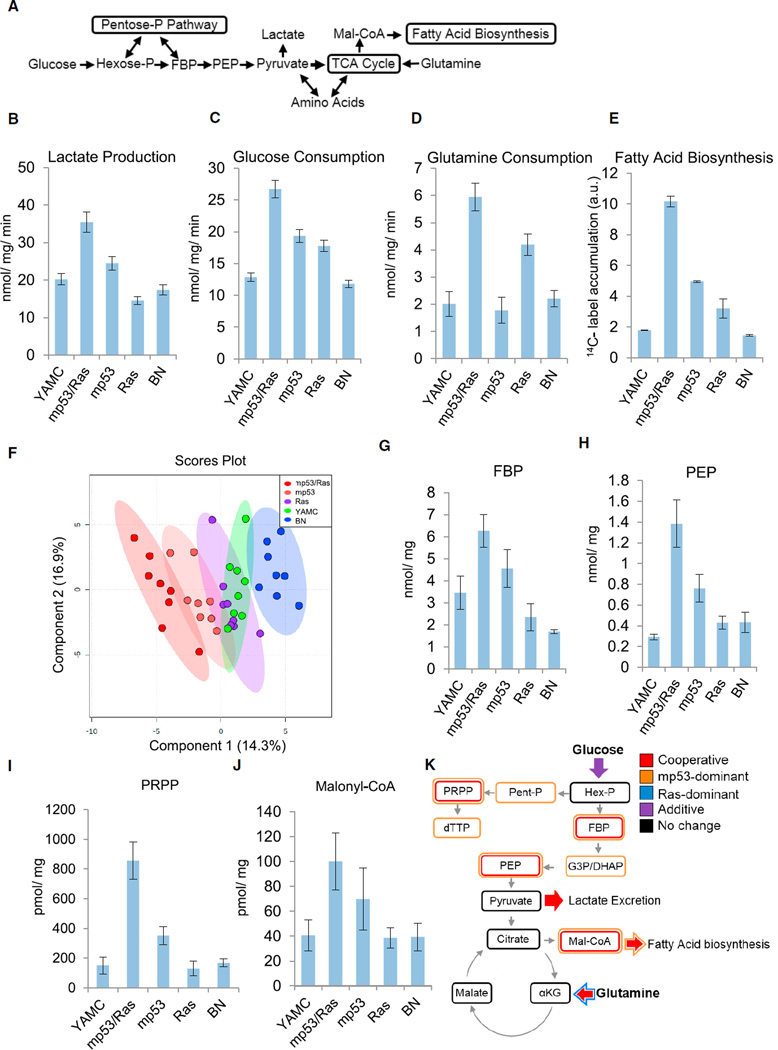
Figure 1. Oncogenic Mutations Act Synergistically to Induce the Cancer Cell Metabolic Program.
(A) Schematic of central carbon metabolism.
(B–D) Extracellular lactate secretion (B), glucose consumption (C), and glutamine consumption (D) of the indicated derivatives of YAMC: combined mutant (mp53/Ras), mp53 alone, Ras alone, or empty vector (BN) cells.
(E) Measurement of fatty acid biosynthesis.
(B–E) Data are means + SE.
(F) Partial least-squares discriminant analysis of metabolic concentrations and the indicated YAMC derivatives.
(G–J) Absolute intracellular metabolite concentrations determined by LC-MS/MS. Data are means + SE.
(K) Oncogenic cooperativity and allele dominance in metabolic reprogramming of murine colon epithelial cells.
Statistically significant differences were assessed by ANOVA as indicated in the Experimental Procedures (Tables S1 and S4). See also Figures S1 and S2 and Tables S1-S4.

