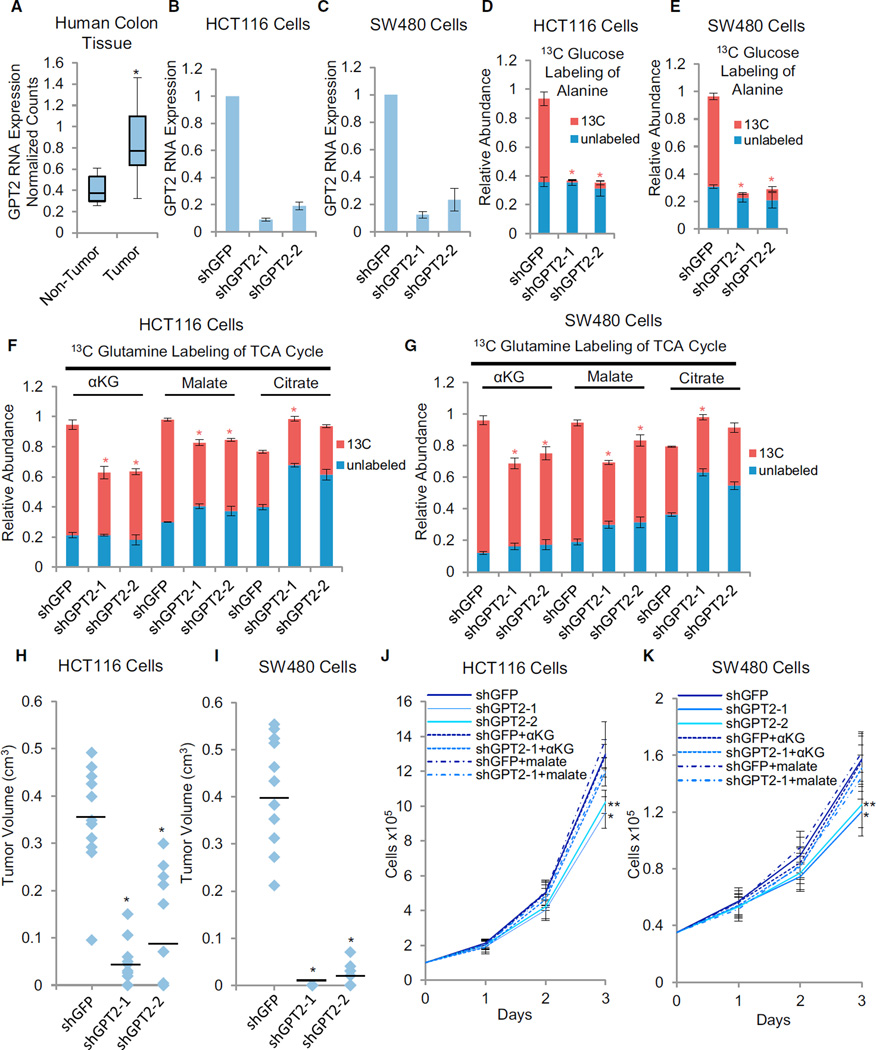
Figure 6. GPT2 Is Critical for Human Colon Cancer Cell Proliferation.
(A) GPT2 RNA expression in human colon tumor versus non-tumor samples. *p < 0.01 versus non-tumor by Student’s t test. The y axis values represent linear scale.
(B and C) GPT2 RNA expression in the indicated derivatives of HCT116 (B) or SW480 (C) cells: shGFP control (shGFP), GPT2 knockdown-1 (shGPT2-1), or GPT2 knockdown-2 (shGPT2-2). Expression of GPT2 was measured via real-time PCR using gene-specific primers.
(D–G). Cells were labeled with 13C-glucose (D and E) or 13C-glutamine (F and G) for 90 min, and the relative abundance of 13C and 12C isoforms was determined by LC-MS/MS. Columns represent total relative abundance, and the 13C portion represents the sum of all detectable isotopologues of a given metabolite. *p<0.01 for 13C isoform abundance of the indicated metabolite versus that metabolite’s 13C isoform abundance in shGFP control by Student’s t test.
(B–E) Data are means + SE.
(H and I) Tumor volumes 4 weeks after 12 subcutaneous implantations of the indicated cell lines in the flanks of nude mice. Median tumor volume is indicated by the horizontal line. *p < 0.01 versus shGFP by Student’s t test.
(J and K) Adherent cell proliferation in the presence of 4 mM αKG or 4 mM dimethyl malate where indicated. Data are means + SD. *p < 0.01 versus all other cell lines, except shGPT2-2, by Student’s t test. **p < 0.01 versus shGFP by Student’s t test.
See also Figures S5 and S7 and Tables S6 and S7.

