
Figure 1.
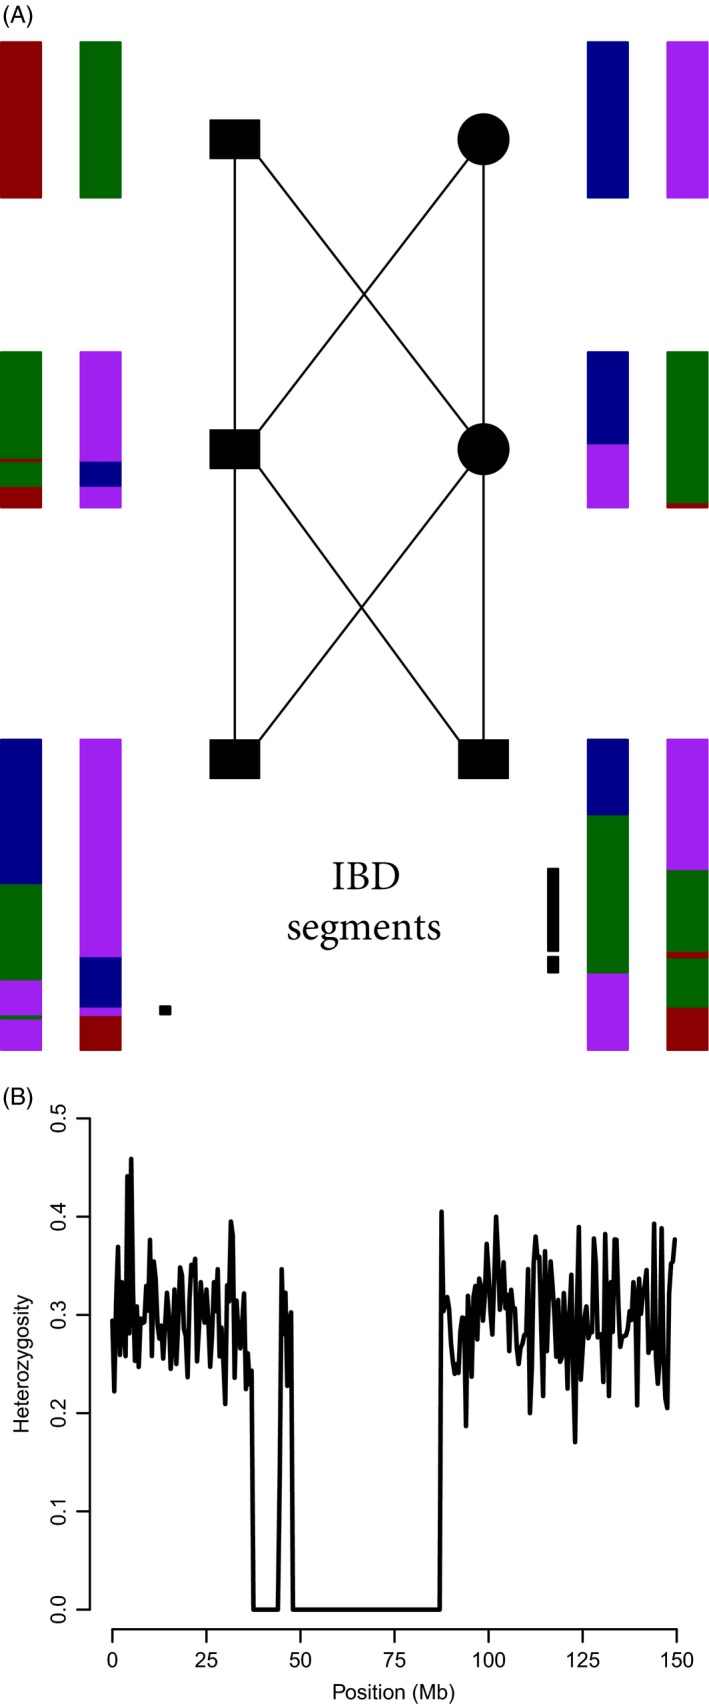
(A) The simulated inheritance of chromosomes of two brothers (bottom squares) whose parents are full siblings. The grandparents each have two unique copies of a single 150‐Mb, 180‐cM chromosome (represented by different colors). The locations of recombination events are represented by the boundaries between different colors in the chromosomes of the offspring. The inbred brother on the left has one IBD chromosome segment (generating one long ROH), and the brother on the right has two (mapped with black bars). (B) The distribution of heterozygosity across the chromosome of the inbred brother on the right in (A). Heterozygosity (y‐axis) is the proportion of heterozygous SNPs in nonoverlapping 500‐kb windows. IBD segments are identified as regions with no heterozygous SNPs. Simulation details are available in the Supporting Information