
Figure 4.
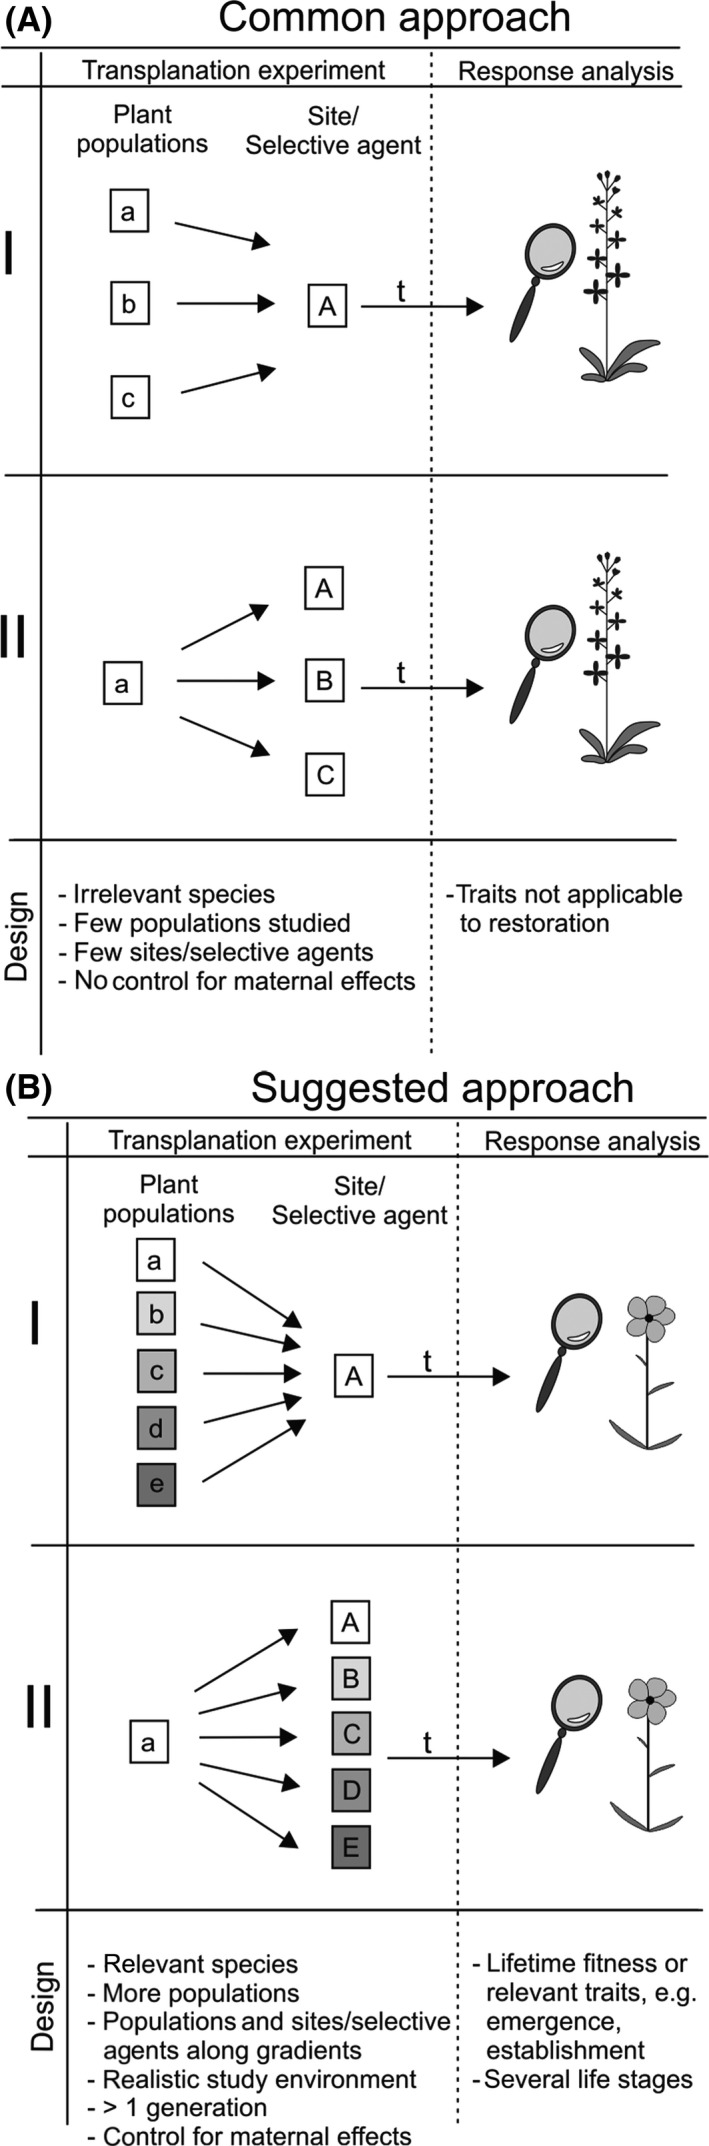
Schematic graph of the (A) common approach to local adaptation experiments and (B) a suggested approach that could make experiments more relevant to land management. Small letters (a–e) indicate plant populations; capital letters (A–E) indicate sites or selective agents; and t indicates time after the beginning of the experiment. In (B), gray‐shaded colors, underlying boxes (a–e, A–E) represent an environmental or geographic gradient. In panel a, material from multiple plant populations is crossed either at one site (I) or with one selective agent (II). In panel b, material from multiple plant populations is crossed with multiple sites or selective agents. Dots indicate that reciprocal transplant is replicated at the remaining sites.