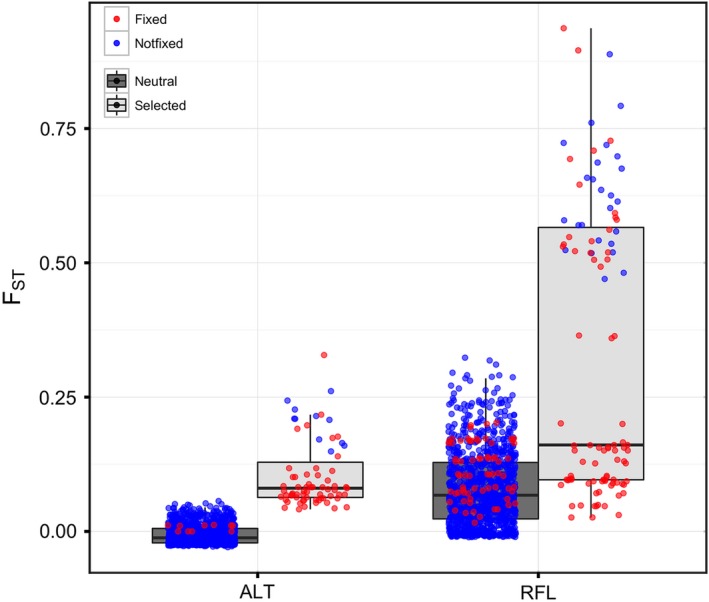
Figure 3.

Boxplots for pairwise FST calculated from the neutral (n = 1036) and divergent selected loci in each population pair. FST values are those calculated in LOSITAN. Red and blue colors denote whether or not the locus was fixed in one of the two populations considered in each pairwise comparison
