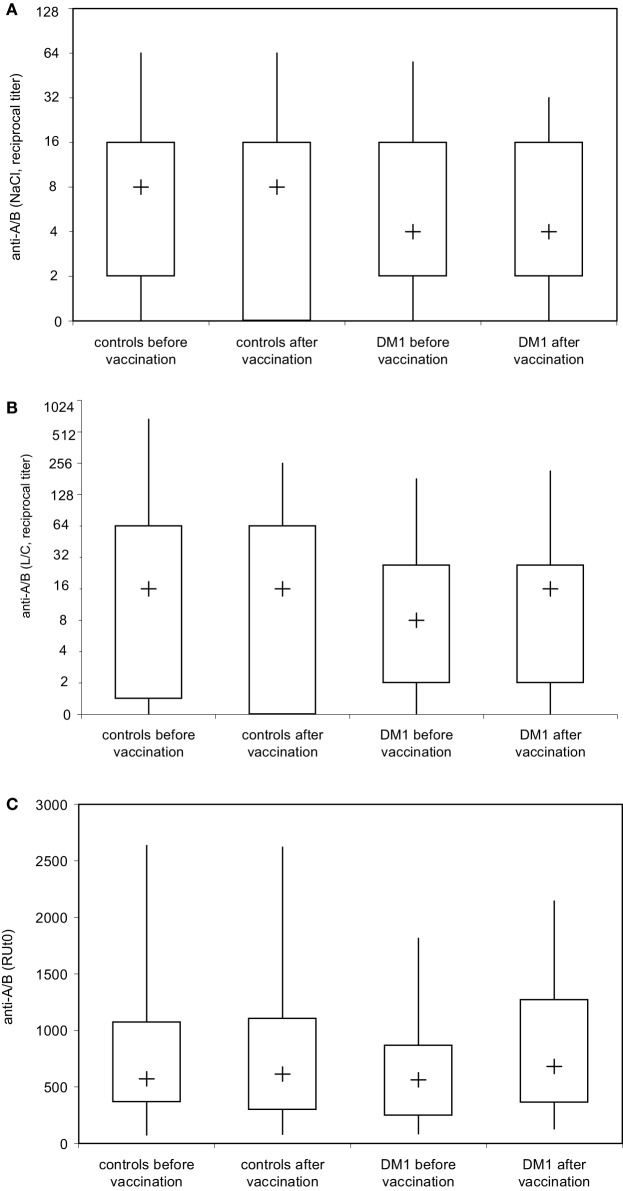
Figure 4.
Analysis of blood group anti-A and anti-B isoagglutinin binding to A and B trisaccharide antigen in real time by surface plasmon resonance (SPR) technology. Serum samples of healthy individuals (n = 28) and patients with type I DM (n = 16) were serially twofold diluted with 0.9% saline solution and blood group anti-A and/or anti-B IgM (A) were determined by ID-Card 50520 (NaCl), while the ID-Card 50531 (LISS/Coombs) was used to determine IgG and IgM isoagglutinins (B). The titer that led to visible agglutination of erythrocytes dispersed in the gel was selected positive. Alternatively (C), serum samples diluted in HES-EP buffer (1:2) were injected over either the blood group A or blood group B trisaccharide-coupled CM5 sensor chip. Binding kinetics, i.e., association and dissociation were recorded as sensorgrams in resonance units (RU) against time in FC-I and FC-II, and the amount of anti-A/B antibody that associated with the blood group A/B trisaccharide antigen immobilized on the sensor chip surface was obtained by subtracting the FC-II value from the FC-I value and is given as resonance units (RU). Results are depicted using box plot diagrams, with the median represented by a cross, the interquartile range (IQR) represented by the box, and 5- and 95-percentile values represented by the whiskers; no statistically significant differences were found between study groups as calculated using the non-parametric two-tailed Mann–Whitney U-test.

