Figure 3.

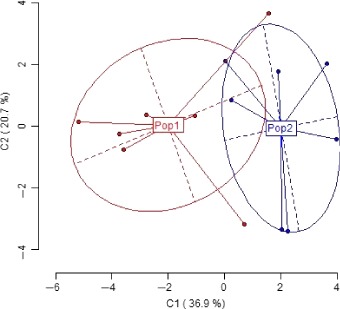
Principal coordinate analysis of methylation‐susceptible loci in the soldiers and the reproductive female castes. Clusters represent the two castes: Pop1 reproductive females, Pop2 soldiers. Explained variance is at 57.6%.

Principal coordinate analysis of methylation‐susceptible loci in the soldiers and the reproductive female castes. Clusters represent the two castes: Pop1 reproductive females, Pop2 soldiers. Explained variance is at 57.6%.