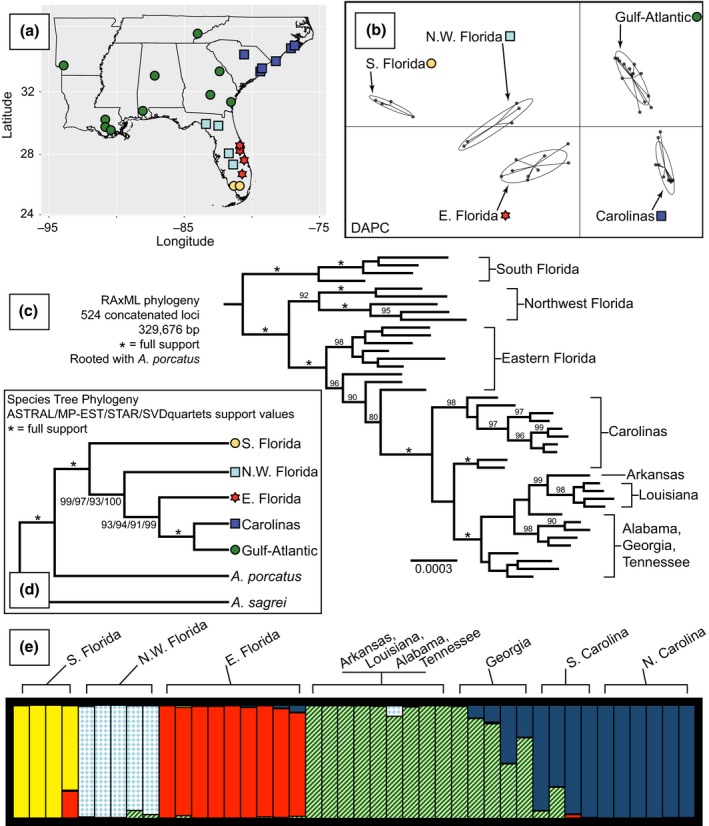
Figure 2.

Sampling and genetic structure. (a) Sampling localities of Anolis carolinensis in the U.S. Southeast. Symbols match corresponding genetic clusters from DAPC analyses. (b) Five genetic clusters identified from DAPC analyses. (c) RAxML phylogenetic tree from 524 concatenated loci. Nodes with <70% bootstrap support are unlabeled. (d) Results of species tree analyses. ASTRAL, MP‐EST, and STAR utilized gene trees generated from loci containing ≥5 parsimony informative sites. All loci were concatenated for use in the SVDquartets analysis. (e) STRUCTURE analysis result for one of the SNP datasets. Each vertical bar represents one individual (proportion of color informs inferred probability of population ancestry)
