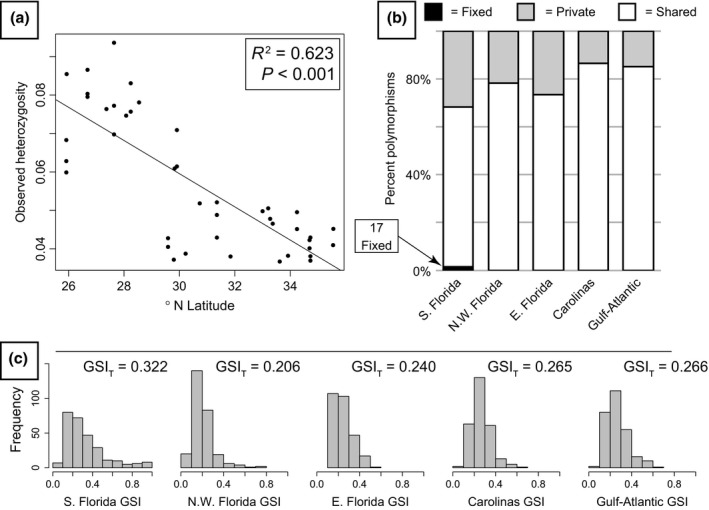
Figure 3.

Genetic diversity and genealogical sorting. (a) Relationship of observed heterozygosity and latitude for all Anolis carolinensis individuals. (b) Proportion of fixed, shared, and private polymorphisms for each genetic cluster, excluding singletons (variants only found as heterozygous in one individual). (c) Genealogical sorting index (GSI) histograms for each genetic cluster across 273 gene trees used in species tree analyses (Fig. 2d) and the ensemble GSI (GSIT) using information from all trees
