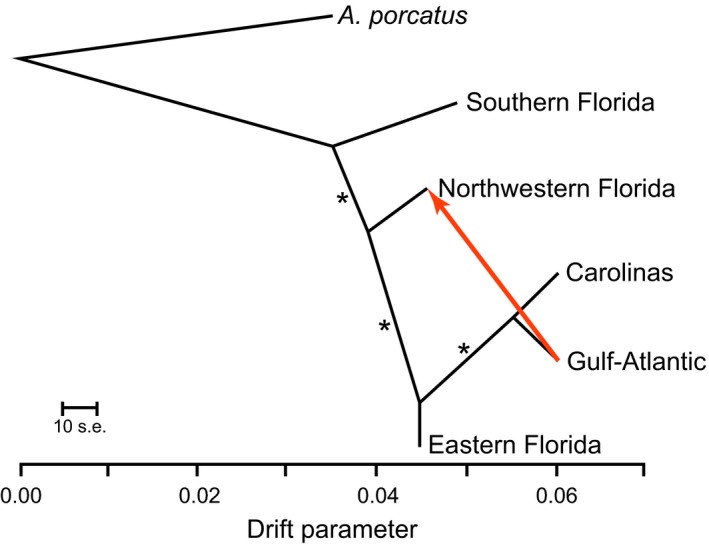
Figure 4.

Output of Treemix analysis, identifying the same relationships as species tree analyses (Fig. 2d). One gene flow event was inferred between the Northwestern Florida and Gulf‐Atlantic phylogeographic clusters. With no migration events, the species tree explains 99.6% of the variation in the SNP data, with an additional 0.3% explained by the potential migration event. Asterisks indicate full support from 100 bootstraps
