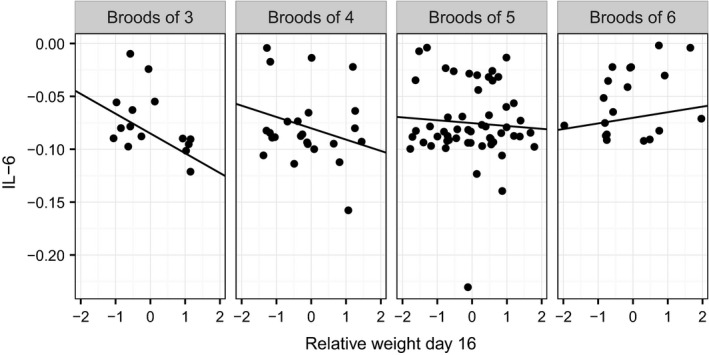
Figure 4.

Plasma IL‐6 (reciprocally transformed and multiplied by −1) against relative weight at day 16 for each observed brood size. Lines represent estimates from the simple slopes analysis based on the full statistical model including a random effect of nest and a fixed effect of sex. Points represent raw data points
