Figure 3.

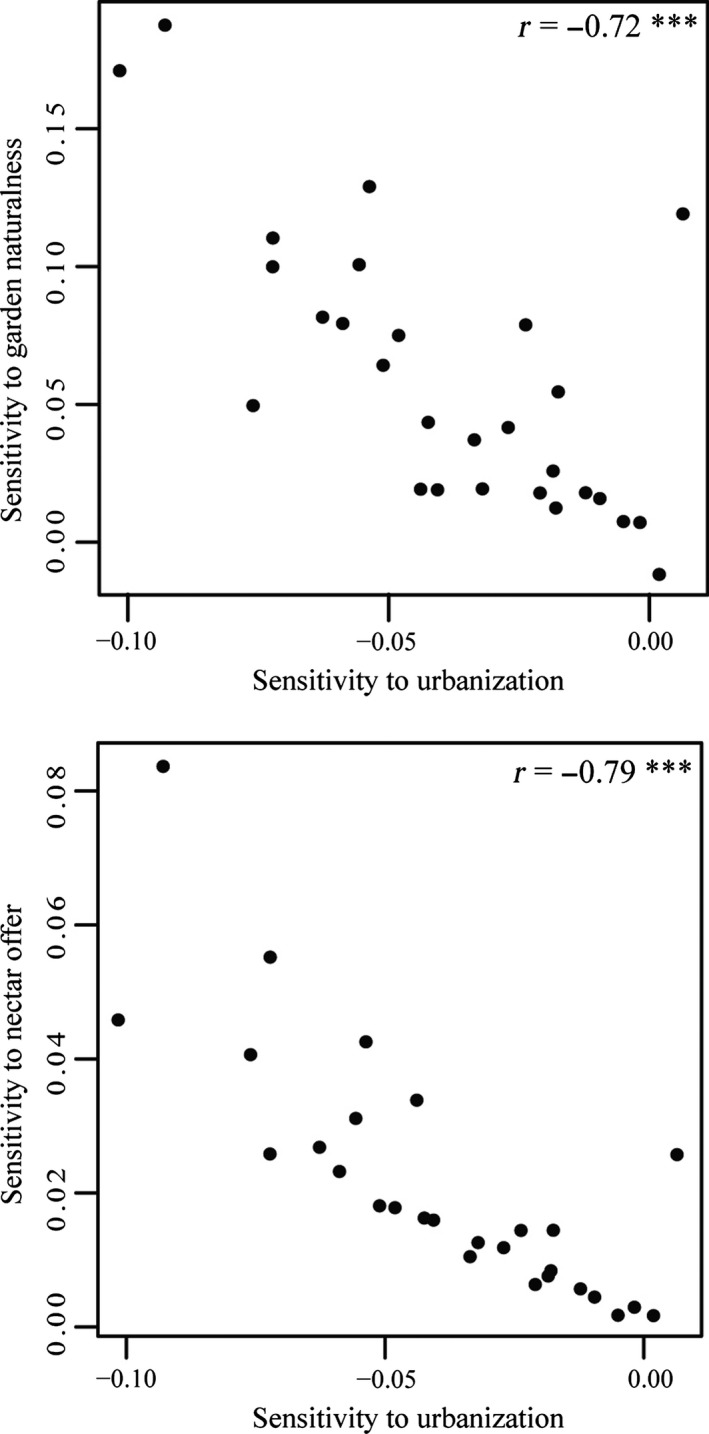
Relationships between slope of response to urbanization and slope of response to garden naturalness (left) and nectar offer in the monitored gardens in France, 2006–2012

Relationships between slope of response to urbanization and slope of response to garden naturalness (left) and nectar offer in the monitored gardens in France, 2006–2012