
Figure 2.
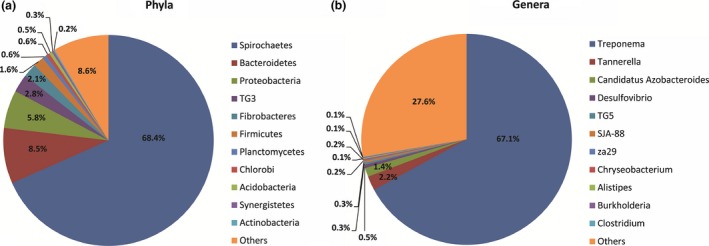
Phylogenetic abundance at the phylum (a) and genus (b) levels compared with individuals in the original state. “Others” represents relative abundance <0.1%
Official websites use .gov
A
.gov website belongs to an official
government organization in the United States.
Secure .gov websites use HTTPS
A lock (
) or https:// means you've safely
connected to the .gov website. Share sensitive
information only on official, secure websites.
Phylogenetic abundance at the phylum (a) and genus (b) levels compared with individuals in the original state. “Others” represents relative abundance <0.1%