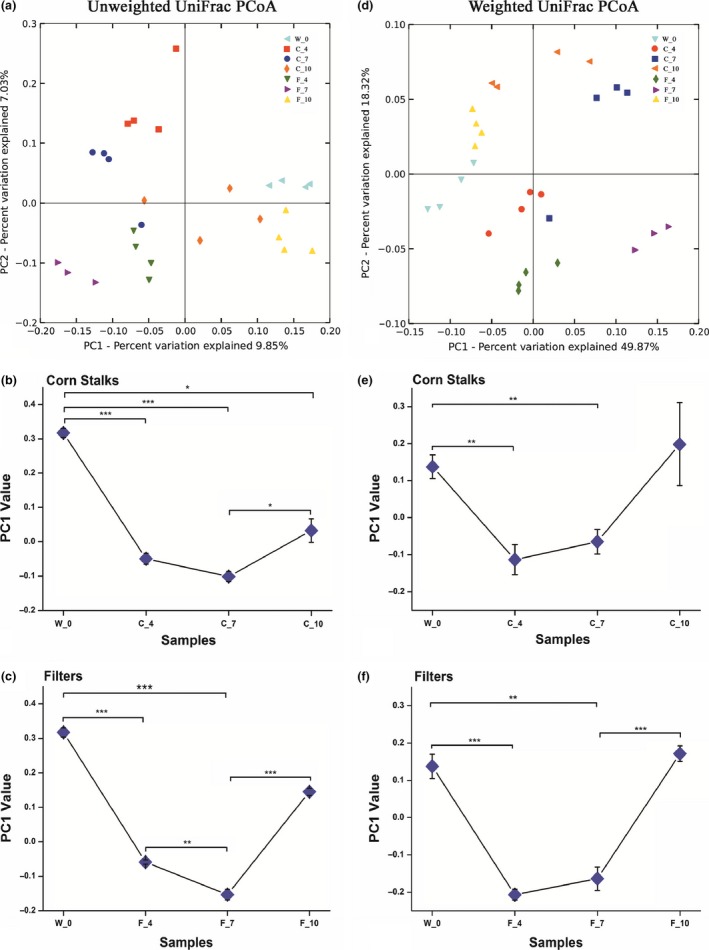
Figure 3.

Unweighted and weighted UniFrac PCoA plots and the mean PC1 values of individual bacterial communities fed corn stalks and filter paper diets based on the unweighted and weighted matrices. (a, d) Principal coordinates analysis (PCoA) plots of the unweighted and weighted UniFrac distances, which were obtained using QIIME. (b, e) Comparison of the mean PC1 value with corn stalks as the substrate and different feeding times. (c, f) Comparison of the mean PC1 value with the filter paper as the substrate and different feeding times. The data represent the mean ± SEM. *p < .05, **p < .01, ***p < .001, according to Wilcoxon's rank‐sum test
