Figure 1.
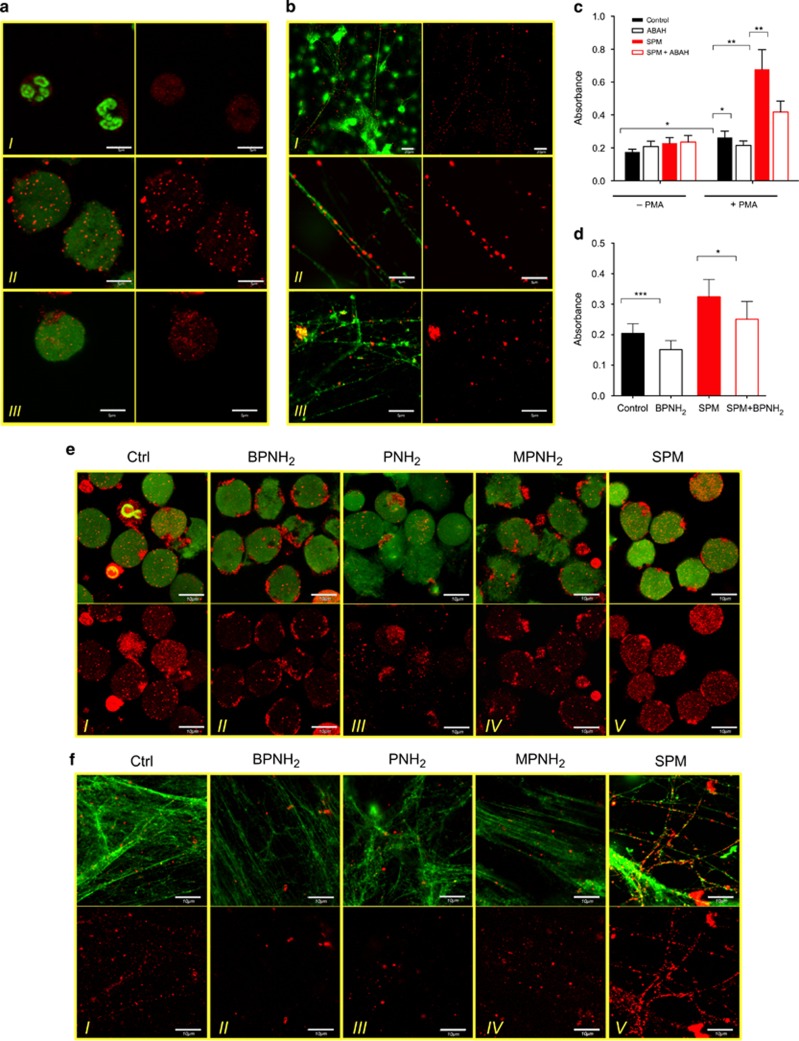
Endogenous and exogenous polyamines are incorporated into cellular and NET-specific proteins during NET formation. (a) Representative images of SPD and SPM distribution in resting (I), 4 h PMA-(II) and S. aureus (III) activated human neutrophils. Left panels show polyamines (red) and DNA (green); right panels show polyamine staining alone. Experiment was repeated at least six times with neutrophils from independent healthy donors, with similar results. Original magnification was × 60, scale bar represents 5 μm. (b) Representative images of SPD and SPM content of NET. Neutrophils were treated with PMA (I–II) or S. aureus (III) and stained as in a. Left panels show polyamines (red) and DNA (green); right panel shows polyamines alone. Experiment was repeated at least six times with neutrophils from independent healthy donors, with similar results. Original magnifications were × 40 (I) or × 60 (II and III) and scale bars represent 20 μm (I) or 5 μm (II and III). (c) Detection of polyamine incorporation into cellular proteins with ELISA. Resting and PMA-activated neutrophils were cultured alone or in the presence of SPM, ABAH (MPO inhibitor) or SPM and ABAH and then covalently conjugated polyamines were quantified from cell lysate. (d) Detection of polyamine incorporation into NET-specific proteins with ELISA. NET formation was induced alone or in the presence of SPM, BPNH2 or SPM and BPNH2 and then covalently conjugated polyamines to proteins were quantified. ELISA experiments for cellular and NET proteins were performed on neutrophils isolated from five independent healthy donors in duplicates. Data are presented as mean±S.E.M. Differences on treatments were tested for significance with paired Student's t-test. *P<0.05; **P<0.01; ***P<0.001. (e) Representative images of SPD/SPM distribution in neutrophils activated for 4 h with PMA alone (I), or in the presence of BPNH2 (II), PNH2 (III), MPNH2 (IV) or SPM (V). Upper panels show polyamines (red) and DNA (green); lower panels show polyamine staining alone. (f) Representative images of SPD/SPM content of the NET from neutrophils treated and stained as in Figure 2a. Upper panels show polyamines (red) and DNA (green); lower panels show polyamine staining alone. Experiment was repeated at least four times with neutrophils from independent healthy donors, with similar results. Original magnification was × 60, scale bar represents 10 μm

