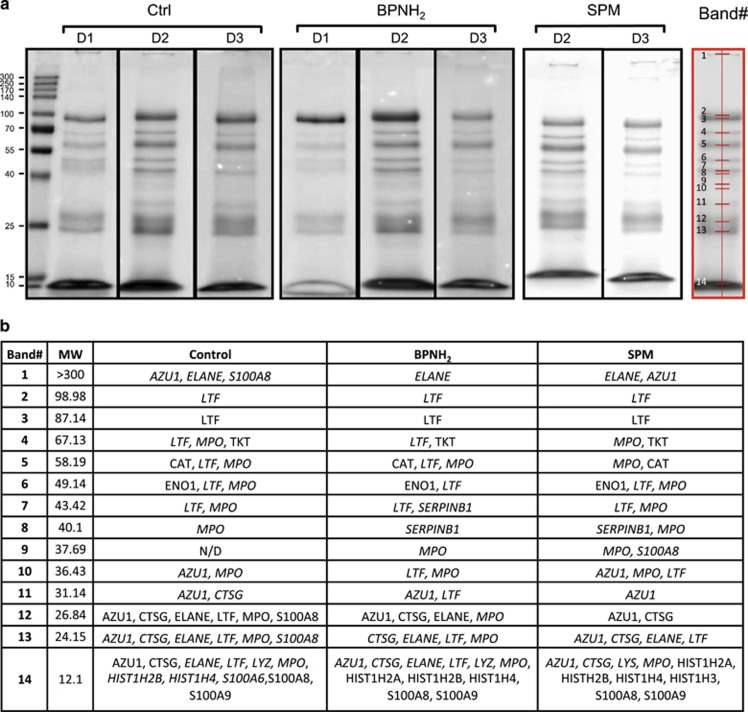
Figure 3.
Proteomic analysis of the NET confirms protein cross-linking. (a) SDS-PAGE of untreated (Ctrl), BPNH2 and SPM treated NET proteins. In all, 20 μg of protein from each sample was subjected to SDS-PAGE on a 12% acrilamide gel for 1.5 h at 30 mA constant current and stained with PageBlue Protein Staining Solution. The detected bands and the band numbers assigned by QuantiyOne (Bio-Rad) band analysis software are marked with red. D1, D2 and D3 indicate three independent healthy donors involved in the analysis. (b) List of proteins identified by LC-MS/MS based mass spectrometry analysis in each band. Italics indicate the presence of proteins at molecular weights different from the expected. The Uniprot gene name of identified proteins is presented in the table. The estimated MW values are also indicated. For protein identification details, see Supplementary Table 1

