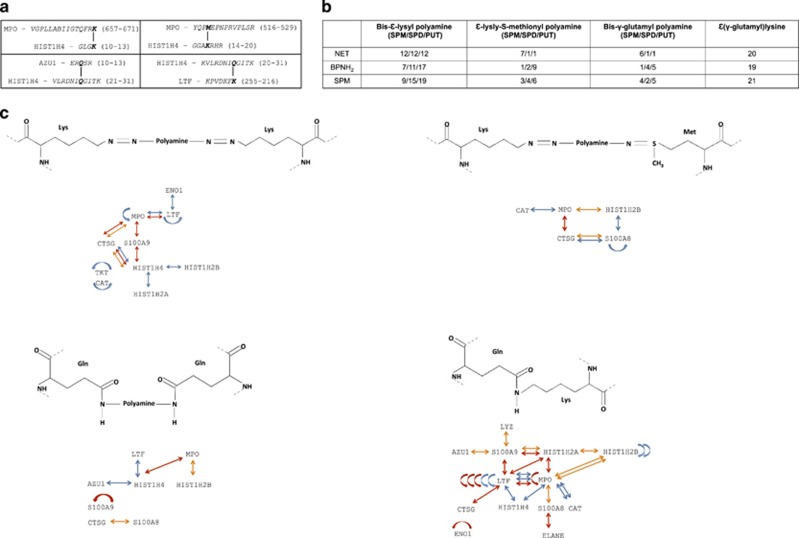
Figure 4.
Analysis of protein cross-links between the identified NET proteins. (a) Selected examples for cross-links formed between the identified NET proteins. (b) The number of cross-links identified by the Stavrox software. The values apply to the number of cross-links confirmed by three independent Stavrox analyzes. (c) Representation of the network of cross-linked NET proteins obtained from donor 3. Blue arrows indicate NET protein cross-links within untreated samples; red arrows show cross-links among NET proteins upon BPNH2 treatment, whereas the orange arrows represent the protein cross-links formed upon SPM treatment. Curved arrows indicate cross-links formed between copies of the same protein. In case of the presented cross-linked proteins, the Uniprot gene names are indicated. For raw data, see Supplementary Table 2

