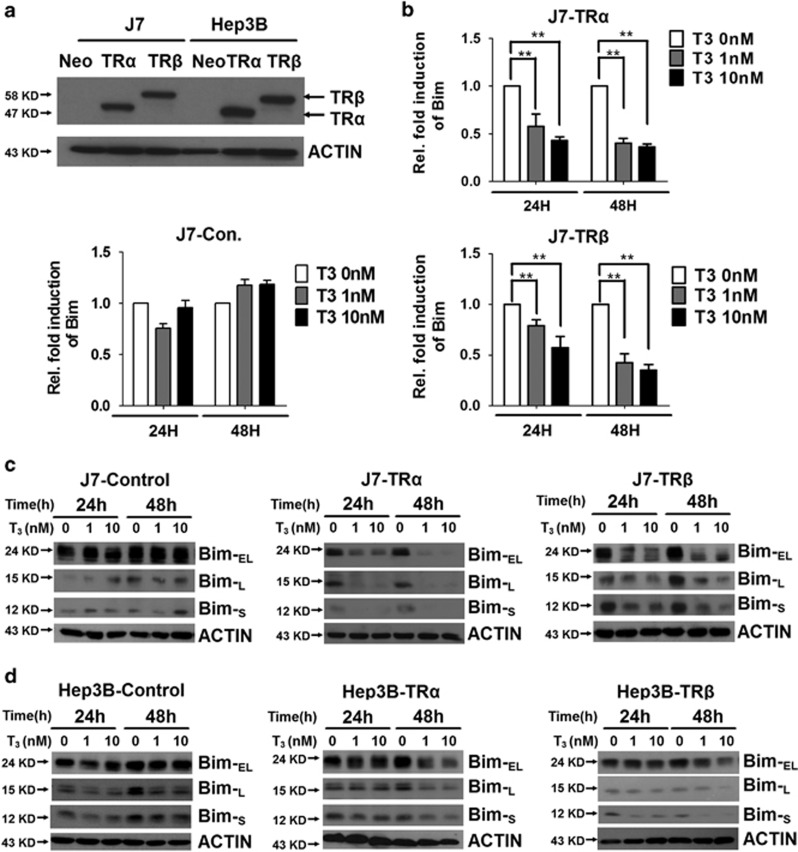
Figure 1.
Effect of T3 on Bim mRNA and protein expression in hepatoma cell lines. (a) Detection of TR protein in TR-overexpressing or control J7 and Hep3B cell lines. (b) RNA from TR-overexpressing or control cell lines maintained in T3-depleted ([T3]=0 nM) or supplemented medium ([T3]=1 or 10 nM) for 24 or 48 h was prepared prior to qRT-PCR analysis of Bim mRNA. Values (means±S.E.M.) are shown as fold induction relative to 0 nM T3. All assays were repeated at least three times. **P<0.01; *P<0.05 (c and d) Levels of the three isoforms of Bim (Bim-EL, Bim-L and Bim-S) in total lysates of isogenic J7 and Hep3B cell lines maintained in the absence or presence of T3 (1 or 10 nM) for 24 or 48 h were determined via western blotting. ACTIN signals served as the loading control

