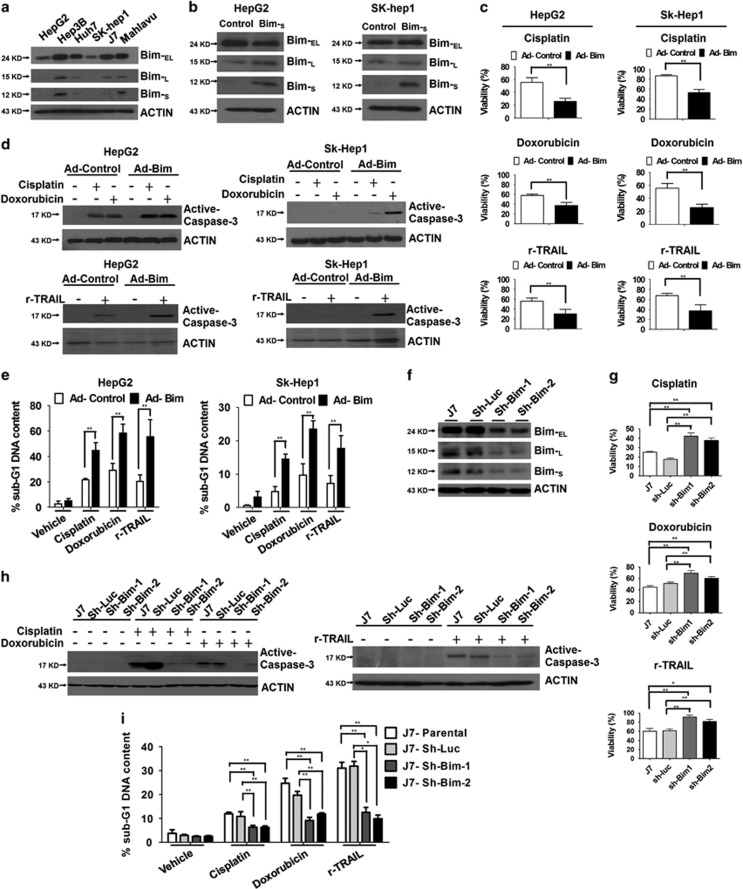
Figure 4.
Bim acts synergistically with cisplatin, doxorubicin and TRAIL to kill hepatoma cells. Detection of Bim proteins in (a) parental HCC cell lines and (b) Ad-Bim-infected HepG2 or SK-hep1 cells. (c) Ad-control or Ad-Bim infected cells were treated with cisplatin (2.5 μg/ml), doxorubicin (2.5 μM) or r-TRAIL (10 ng/ml) for 48 h. After stimulation, cell viability was measured using the MTT assay, and data are presented as relative absorbance values (%) of vehicle-treated cells. (d and e) Control and Bim-overexpressing cells were treated with the indicated reagents for 24 h, the extent of caspase-3 activation determined via western blotting (d), and the proportions of apoptotic cells in samples subjected to various treatments assessed using propidium iodide (PI) staining and flow cytometry (e). Values are presented as means±S.E.M. of data from experiments performed in triplicate. Differences between data were evaluated using Student's t-test (**P<0.01; *P<0.05). (f) Immunoblot analysis of the expression patterns of Bim proteins in J7 cells infected with lentivirus expressing luciferase (Sh-Luc) or Bim-targeting shRNA. (g) Control (Sh-Luc) or Bim-depleted (Sh-Bim) cells were treated with cisplatin (2.5 μg/ml), doxorubicin (2.5 μM) or r-TRAIL (10 ng/ml) for 48 h, and cell viabilities were determined via the MTT assay. The extent of caspase-3 activation and proportion of apoptotic cells were determined via (h) western blotting and (i) flow cytometry, respectively, and cell viability was measured using the MTT assay. (h) After treatment with the indicated reagents for 24 h, caspase-3 activation in control or Bim-depleted cells was determined via western blotting analysis. (i) PI staining and flow cytometry were performed to assess the proportion of the sub-G1 phase in samples subjected to various treatments

