Figure 6.
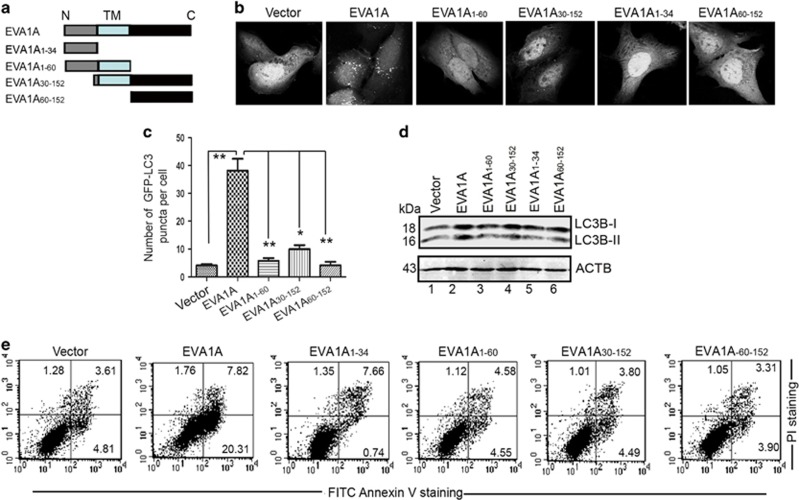
Structure–function correlation of EVA1A mutants. (a) Schematic representations of the WT EVA1A and its mutants. (b) Representative confocal microscopy images of GFP–LC3B distribution in U2OS cells transfected with indicated plasmids for 18 h. (c) Quantification of GFP–LC3B puncta per cell treated as in (b). Data are the mean±S.D. of at least 50 cells scored (*P<0.05, **P<0.01). (d) Western blot analysis of endogenous LC3B-II levels in U2OS cells treated as in (b). (e) U2OS cells were transfected with indicated plasmids for 36 h. Apoptotic cells were measured by FITC–Annexin V and PI staining followed by flow cytometry analysis. *P<0.05, ** P<0.01

