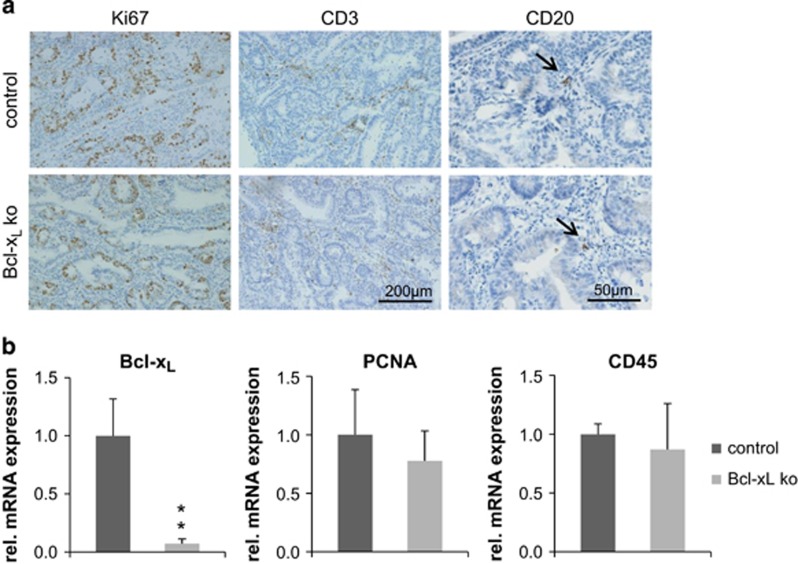
Figure 5.
Analysis of proliferation and lymphocyte infiltration in AOM/DSS-induced tumors. (a) IHC staining against Ki67 (left column), revealing equal proliferation rates in Bcl-xL-negative and control tumors. Staining with antibodies against CD3 (T cells) and CD20 (B cells), showing no differences in T-cell or B-cell (black arrows) abundance in Bcl-xL-negative as well as control tumors. (b) Determination of Bcl-xL, PCNA (proliferation, P=0.45) and CD45 (all leukocytes, P=0.6) mRNA levels by qRT-PCR, showing no significant differences in the proliferation rate or leukocyte infiltration in Bcl-xL-negative and control tumors (n=3 per group, measurement done in technical duplicates). Values are expressed as means+S.D. **P<0.01

