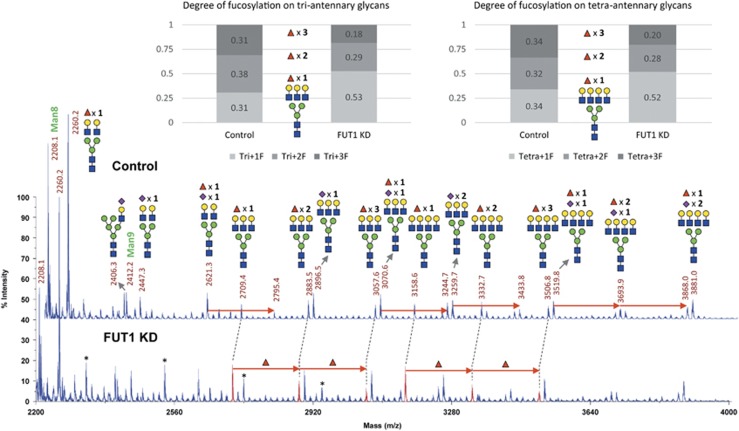
Figure 3.
MALDI-TOF mass spectra of complex N-glycan from purified LAMP-2 expressed in control and FUT1 knockdown T47D cells. The changes of fucosylation level on tri- and tetra-antennary N-glycans were illustrated as relative abundance of each glycoform (as shown in different shades of gray boxes). Notably, the levels of fucosylation decreased in both tri- and tetra-antennary N-glycans of LAMP-2 in FUT1 knockdown cells as compared with that in control cells. The molecular ions representing complex glycans with degree of fucosylation were highlighted in the lower spectrum as red peaks at m/z 2709, 2883 and 3057 for tri-antennary and m/z 3158, 3332 and 3506 for tetra-antennary N-glycans, respectively. The relative ratio of each glycoform is given in percentage of total sum of peak intensities of tri- and tetra-antennary glycans in the MS spectra. The colored symbol and nomenclature for glycan structure are based on the designation of Consortium for Functional Glycomics as described in Figure 2a. Peaks labeled with asterisks represent polyhexose ladder contaminations that were negligible for overall analysis

