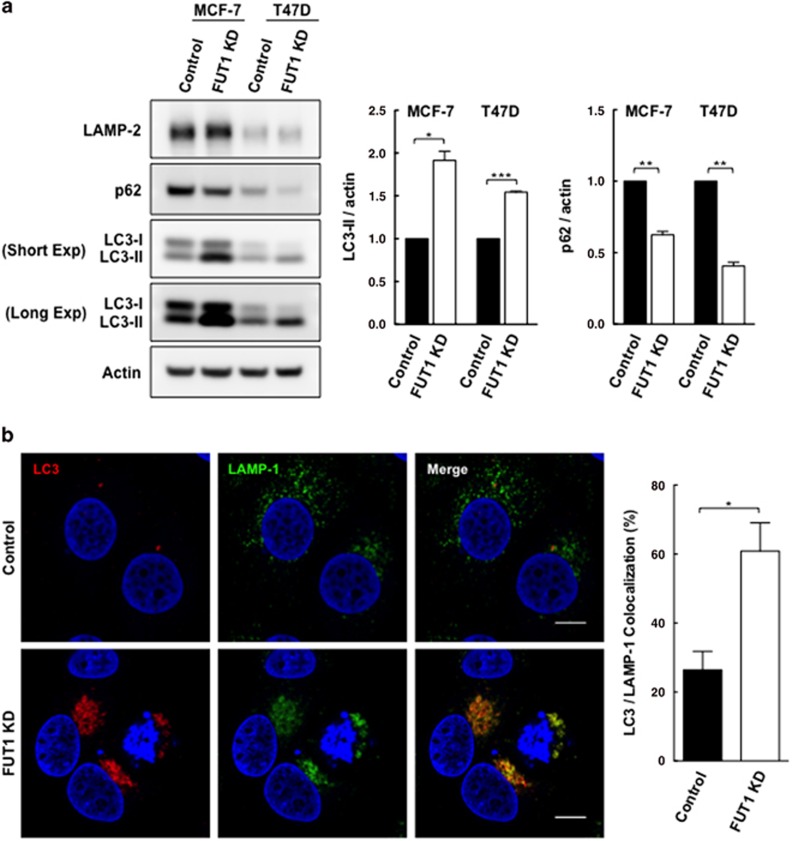
Figure 5.
Knockdown of FUT1 is associated with an increase in autophagic flux. (a) Immunoblot analysis of LC3-II and p62 levels in control and FUT1 knockdown cells. Total cell lysates from MCF-7 and T47D cells transfected with control or FUT1 siRNAs were collected at 120 and 96 h post-transfection, respectively. Equal amounts of cell lysates were then loaded in each lane and separated by SDS-PAGE. Immunoblot analysis was performed with LC3 and p62 antibodies. Actin was used as a loading control. The intensity of LC3-II and p62 protein bands on immunoblot were quantified and normalized to actin, and the relative levels of protein expression were expressed as fold change by setting the control group value to 1. Values shown are mean±S.E.M. of three independent experiments (***P<0.001; **P<0.01; *P<0.05). (b) Downregulation of FUT1 enhanced the fusion of autophagosome and lysosomes in MCF-7 cells. Cells were co-stained with anti-LAMP-1 (green) and anti-LC3 (red) and nuclei stained with Hoechst (blue). Representative colocalization signals (referred to as autolysosomes) were shown in yellow in the merged. Magnification × 63, zoom: × 3. Scale bars, 10 μm. Histogram shows the percentages of autolysosomes (LC3+/LAMP-1+) to autophagosomes (LC3+/LAMP-1−). Data are mean±S.E.M. of three independent experiments of >100 cells per group (*P<0.05)

