Figure 6.
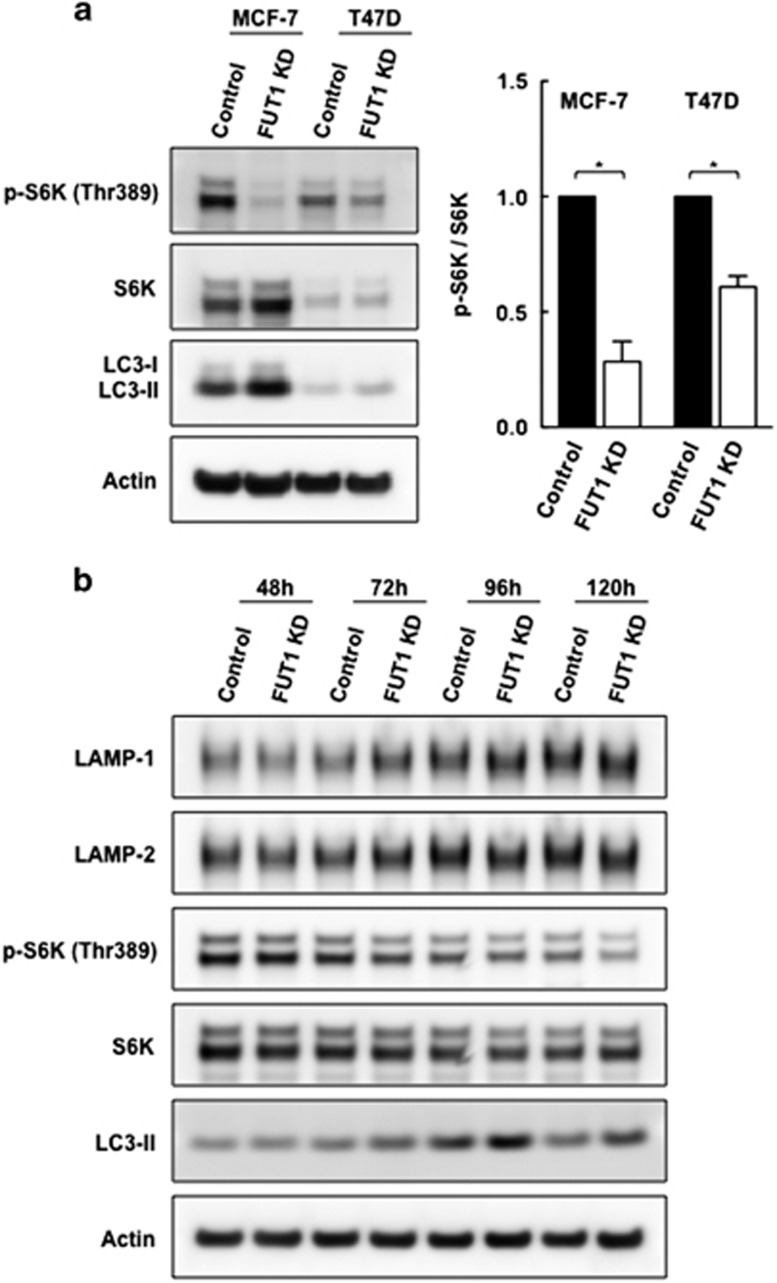
Knockdown of FUT1 is associated with decreased mTORC1 activity. (a) Representative immunoblots and quantitative analysis of mTOR activity in control and FUT1 knockdown cells. Lysates of MCF-7 and T47D cells transfected with control or FUT1 siRNAs were subjected to immunoblot analysis with antibodies against phospho-p70 S6K (Thr389) and total S6K. The resulting immunoblot bands were then quantified and computed as phospho-p70 S6K/total S6K ratio for mTOR activity. Values shown are mean fold change±S.E.M. of three independent experiments (*P<0.05). (b) Time course of mTORC1 activity in control and FUT1 knockdown MCF-7 cells. mTOR activity was determined by immunoblot analysis for the phosphorylation status of p70 S6K from 48 to 120 h after FUT1 knockdown. Levels of LAMP-1, LAMP-2 and LC3-II were analyzed in parallel over the indicated time points and actin was used as a loading control. Results are representative of two independent experiments

