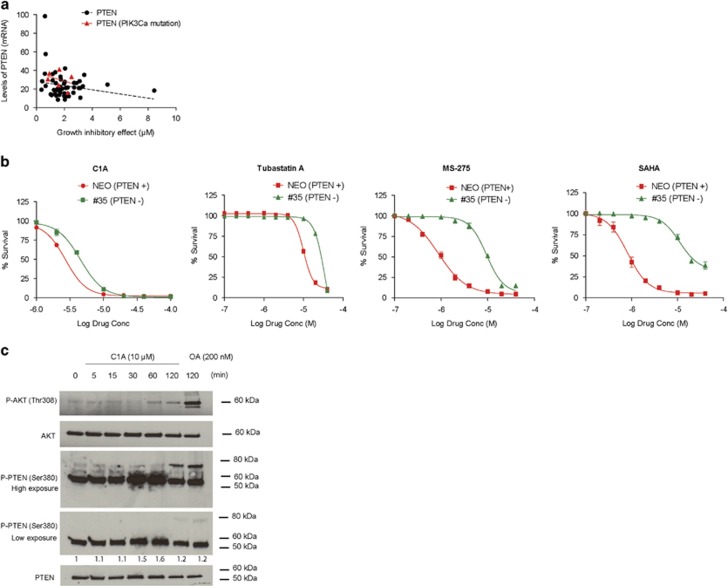
Figure 2.
HDAC6 inhibition in relation to PTEN expression and activation. (a) Relationship between the growth inhibitory effect of C1A and mRNA levels of PTEN. The growth inhibitory effect of C1A was tested across the NCI60 panel following 72 h exposure. Data on mRNA levels and PIK3CA mutation status were from the Developmental Therapeutics Program (NCI/NIH) available online. (b) Growth inhibitory effect of HDAC inhibitors in HCT-116 cells proficient (NEO) and deficient (#35) in PTEN.18 HCT-116 Neo and #35 were treated with HDAC6 inhibitors (C1A and Tubastatin A), pan HDAC inhibitor (SAHA) and HDAC class I-specific inhibitor (MS-275) for 24 h. All compounds were used at 10 μM. (c) Impact of C1A treatment on PTEN phosphorylation. P-PTEN (Ser380) expression was compared to total PTEN, P-AKT (Thr308) and total AKT expression. Densitometry data are the ratios between P-PTEN and PTEN and normalized to untreated control. For clarity, two exposure times for western blot were used

