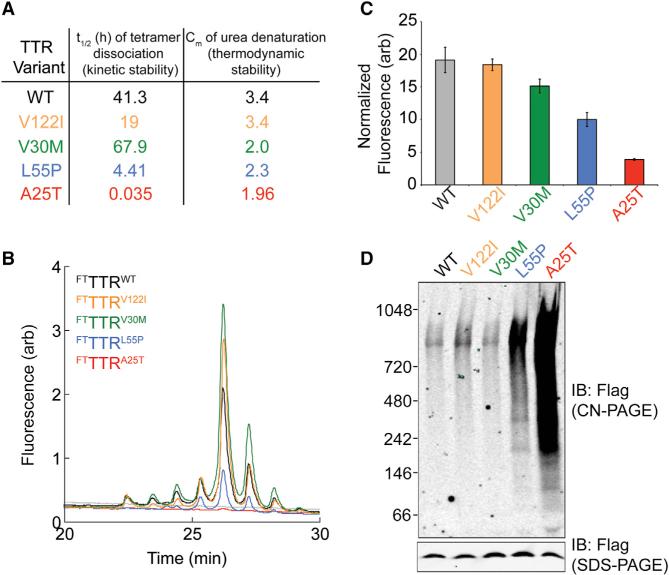
Figure 2. TTR Tetramers Composed of Destabilized Variants Are Unstable in Conditioned Media.
(A) Table showing the t1/2 of tetramer dissociation (a measure fof kinetic stability) and Cm of urea denaturation (a measure of thermodynamic stability) at 25°C for TTRWT and the disease-associated TTR variants TTRV122I, TTRV30M, TTRL55P, and TTRA25T. These values were reported previously (Sekijima et al., 2005).
(B) Representative plot showing the compound 1-TTR conjugate fluorescence of media conditioned for 16 hr on HEK293 cells expressing FTTTRWT (black), FTTTRV122I (orange), FTTTRV30M (green), FTTTRL55P (blue), or FTTTRA25T (red). Compound 1 (10 μM) was added to conditioned media for 16 hr prior to analysis by UPLC anion-exchange chromatography.
(C) Graph showing the normalized compound 1-TTR conjugate fluorescence for plots such as those shown in Figure 2B. Normalization of compound 1-TTR conjugate fluorescence was performed by integrating the fluorescence signal from all peaks corresponding to the TTR tetramer and then normalizing to the relative amounts of TTR in each conditioned media determined by SDS-PAGE/immunoblotting (see Figure S2B). Error bars show SEM for n = 3.
(D) Clear native (CN)-PAGE and SDS-PAGE immunoblots of media conditioned for 16 hr on HEK293 cells expressing FTTTRWT, FTTTRV122I, FTTTRV30M, FTTTRL55P, or FTTTRA25T.

