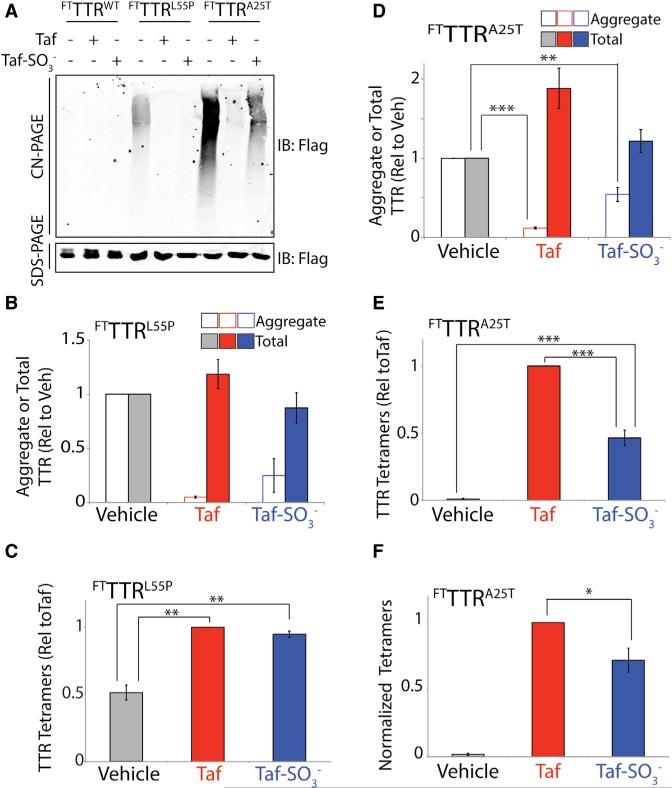
Figure 5. Highly Destabilized TTR Variants Can Be Secreted as Native Tetramers and in Non-Tetrameric Conformations.
(A) Representative CN-PAGE and SDS-PAGE immunoblots of media conditioned for 16 hr on HEK293 cells expressing FTTTRWT, FTTTRL55P, or FTTTRA25T in the presence of Taf (10 μM) or Taf-SO3− (all at 10 μM).
(B) Graph showing the quantification of aggregate (open bars; measured by CN-PAGE) or total (solid bars; measured by SDS-PAGE) FTTTRL55P in media conditioned on HEK293 cells in the presence of vehicle (gray), Taf (10 μM; red), or Taf-SO3− (10 μM; blue). Representative immunoblots are shown in (A). Error bars show SEM for n = 3.
(C) Graph showing tetramer levels in media conditioned on HEK293 cells expressing FTTTRL55P in the presence of vehicle (gray), Taf (10 μM; red), or Taf-SO3− (10 μM; blue). Tetramer levels were quantified by integrating compound 1-TTR conjugate fluorescence measured by UPLC and are shown relative to Taf-treated cells. A representative UPLC trace is shown in Figure S4A. Error bars show SEM for n = 4. **p < 0.01.
(D) Graph showing the quantification of aggregate (open bars; measured by CN-PAGE) or total (solid bars; measured by SDS-PAGE) FTTTRA25T in media conditioned for 16 hr on HEK293 cells in the presence of vehicle (gray), Taf (10 μM; red), or Taf-SO3− (10 μM; blue). Representative immunoblots are shown in (A). Error bars show SEM for n = 8. ***p < 0.005, **p < 0.01.
(E) Graph showing tetramer levels in media conditioned for 16 hr on HEK293 cells expressing FTTTRA25T in the presence of vehicle (gray), Taf (10 μM; red), or Taf-SO3− (10 μM; blue). Tetramer levels were quantified by integrating compound 1-TTR conjugate fluorescence measured by UPLC and are shown relative to Taf-treated cells. A representative UPLC trace is shown in Figure S4B. Error bars show SEM for n = 4. ***p < 0.005.
(F) Graph showing the normalized compound 1-TTR conjugate fluorescence of TTR tetramers in media conditioned for 16 hr on HEK293 cells expressing FTTTRA25T in the presence of vehicle (gray), Taf (10 μM; red), or Taf-SO3− (10 μM; blue). Compound 1-TTR conjugate fluorescence was normalized to the average relative amounts of total FTTTRA25T (measured by SDS-PAGE; A) to account for differences in total protein in media prepared in the presence of Taf or Taf-SO3−. Error bars show SEM for n = 4. *p < 0.05.

