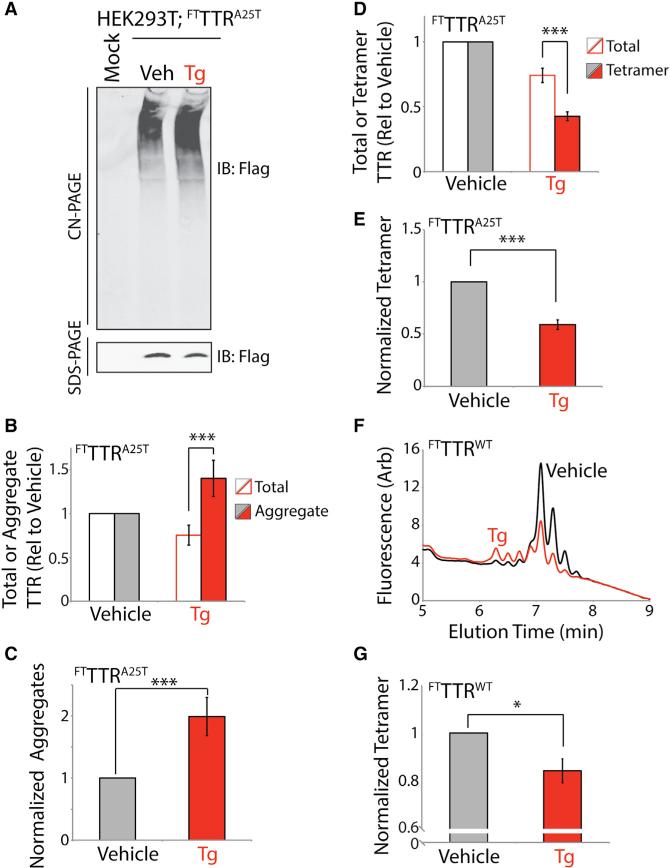
Figure 6. Thapsigargin-Induced ER Stress Reduces Secretion of FTTTRA25T as Tetramers and Increases Extracellular TTR Aggregates.
(A) Representative CN-PAGE and SDS-PAGE immunoblots of media conditioned for 16 hr on HEK293 cells expressing FTTTRA25T in the presence of vehicle or thapsigargin (Tg) (0.5 μM). All media were conditioned in the presence of Taf-SO3− (10 μM).
(B) Graph showing total TTR (open bars; measured by SDS-PAGE) and aggregate TTR (closed bars; measured by CN-PAGE) in media conditioned for 16 hr on HEK293 cells expressing FTTTRA25T in the presence of vehicle (gray) or Tg (red; 0.5 μM). All media were conditioned in the presence of Taf-SO3− (10 μM). Representative immunoblots are shown in (A). Data are shown relative to vehicle-treated cells. Error bars show SEM for n = 12. ***p < 0.005.
(C) Graph showing normalized TTR aggregates in the conditioned media described in (A) and (B). Normalized aggregates were calculated by dividing the relative amounts of aggregate by the total amount of TTR in each sample measured by SDS-PAGE. This normalization is necessary to account for the reduced total FTTTRA25T levels observed in Tg-treated cells. Error bars show SEM for n = 12. ***p < 0.005.
(D) Graph showing total TTR (open bars; measured by SDS-PAGE) and tetrameric TTR (closed bars; measured by integrated compound 1-TTR conjugate fluorescence from UPLC traces) in media conditioned for 16 hr on HEK293 cells expressing FTTTRA25T in the presence of vehicle (gray) or Tg (red; 0.5 μM). All media were conditioned in the presence of Taf-SO3− (10 μM). A representative UPLC trace is shown in Figure S5B. Data are shown relative to vehicle-treated cells. Error bars show SEM for n = 15. ***p < 0.005.
(E) Graph showing normalized TTR tetramers in the conditioned media described in (D). Normalized tetramers were calculated by dividing the relative tetramer levels by the total amount of TTR in each sample measured by SDS-PAGE. This normalization is necessary to account for the reduced total FTTTRA25T levels observed in Tg-treated cells. Error bars show SEM for n = 15. ***p < 0.005.
(F) Representative plot showing compound 1-TTR conjugate fluorescence of media conditioned for 16 hr on HEK293 cells expressing FTTTRWT in the presence (red) or absence (black) of Tg (0.5 μM). Media were conditioned in the presence of Taf-SO3− (10 μM). Compound 1 (10 μM) was added to conditioned media for 16 hr prior to analysis by UPLC anion-exchange chromatography.
(G) Graph showing normalized FTTTRWT tetramers in the conditioned media described in (F). Normalized tetramers were calculated by dividing the relative tetramer levels by the total amount of TTR in each sample measured by SDS-PAGE. This normalization is necessary to account for the reduced total FTTTRWT levels observed in Tg-treated cells. Independent quantifications of total FTTTRWT (measured by SDS-PAGE) and tetrameric FTTTRWT (measured by integrated compound 1-TTR conjugate fluorescence from UPLC traces) in these conditioned media are shown in Figure S5G. Error bars show SEM for n = 6. *p < 0.05.

