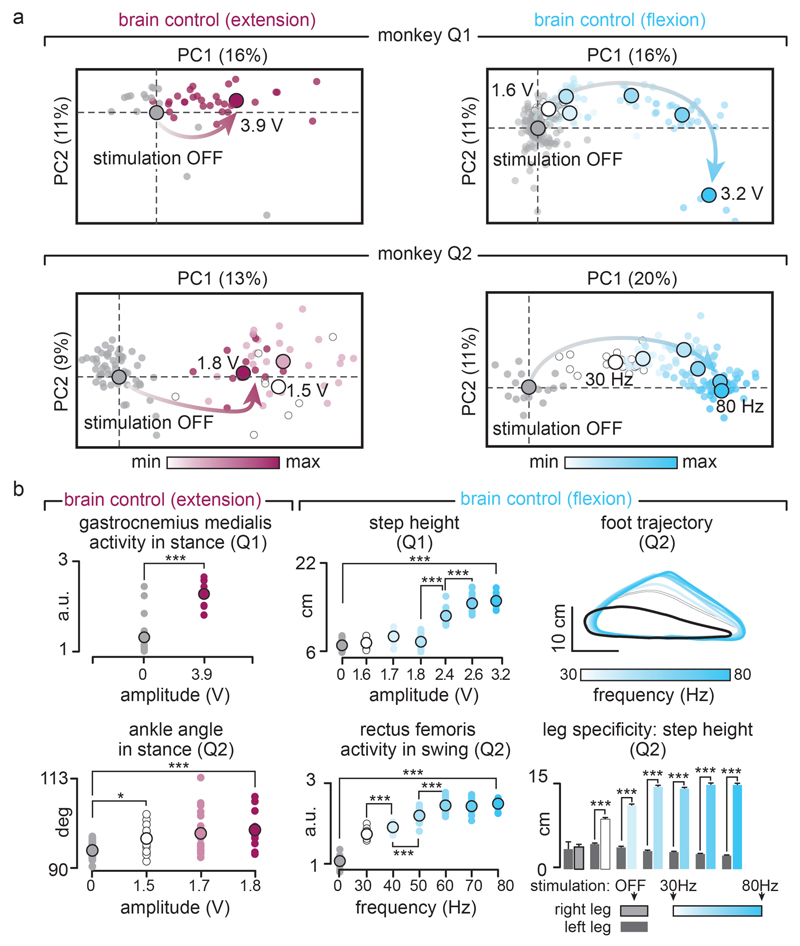
Extended Data Figure 6. Modulation of leg locomotor movements during brain-controlled stimulation in intact monkeys.
(a) PC analysis was applied on individual gait cycles extracted from locomotion on a treadmill without stimulation (n = 125 and n = 119 for Q1 and Q2) and during brain-controlled stimulation of the extension (n = 33 and n = 54 gait cycles with stimulation for Q1 and Q2, respectively) or flexion (n = 98 and n = 120 total stimulation steps for Q1 and Q2, respectively) hotspots for the intact monkeys Q1 and Q2. Conventions are the same as in Figure 3 and Extended Data Figure 7. This analysis emphasizes the graded modulation of gait parameters when increasing the frequency or amplitude of stimulation for extension and flexion hotspots independently. (b) Plots showing relationships between the amplitude or frequency of extensor (magenta) or flexor (cyan) hotspot stimulation and relevant kinematic or muscle activity parameter related to the extension or flexion of the right leg. The upper right plot shows the average foot trajectories during each experimental condition, illustrating the graded modulation of flexion during brain-controlled stimulation of the flexion hotspot. The lower right plot highlights the high degree of leg-specific modulation over the entire extent of tested stimulation parameters. Results were comparable in monkey Q1 and Q2. ***,* p<0.001 and p<0.05, respectively. Wilcoxon rank sum test. Error bars, s.e.m.

