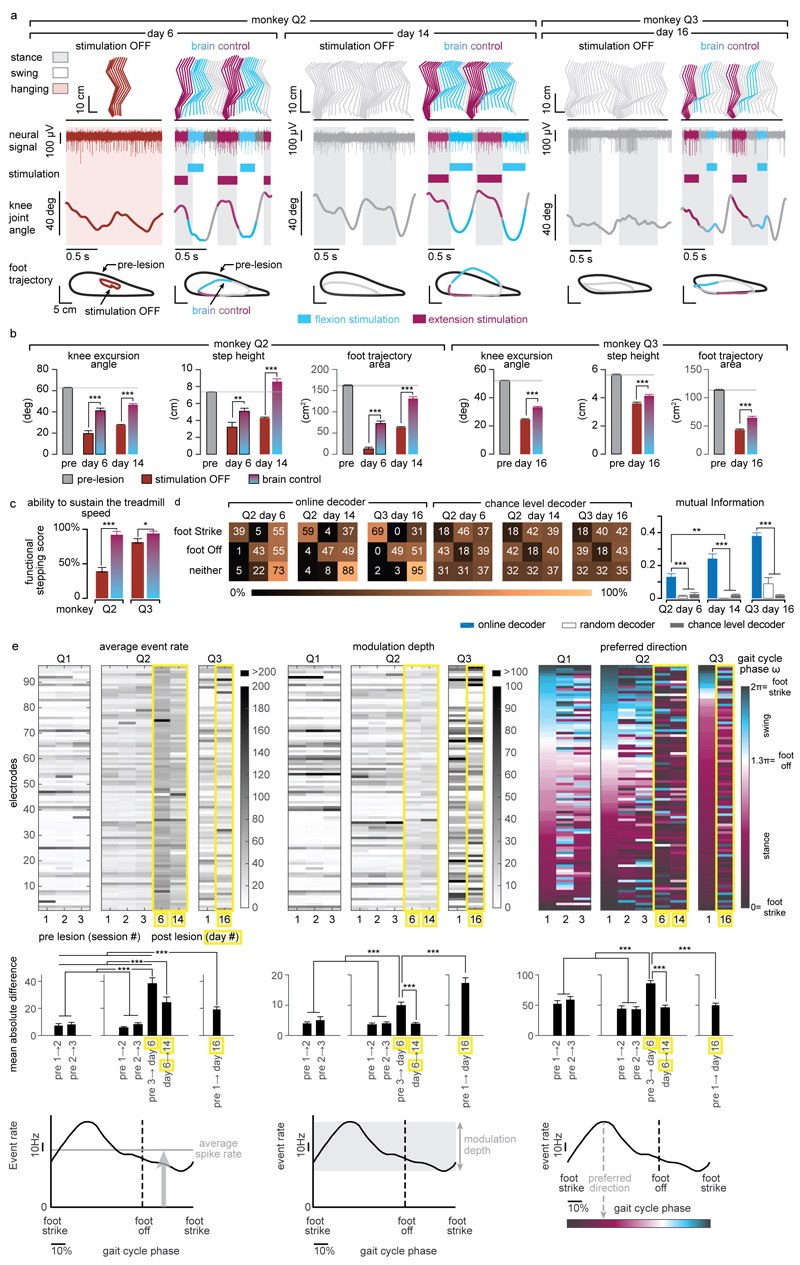
Extended Data Figure 9. Quantification of gait improvements and decoding accuracy during brain-controlled stimulation after the spinal cord lesion.
(a) Two successive gait cycles performed during locomotion on a treadmill without stimulation and during brain-controlled stimulation in monkey Q2 at 6 and 14 days post-lesion, and in monkey Q3 at 16 days post-injury. Conventions are the same as in Figure 4. In addition, the average foot trajectories calculated over all the recorded gait cycles are displayed for each experimental condition including during pre-lesion locomotion, illustrating the marked improvement of foot movements during brain-controlled stimulation. (b) Bar plot reporting the mean values of the total excursion of the angle, step height and foot trajectory area for monkey Q2 and Q3 during locomotion pre-lesion and post-lesion without stimulation and with brain-controlled stimulation. Analysis was only applied to gait cycles classified as steps, i.e. gait cycles classified as limb paralysis or stumbling were not included (Q2: pre-lesion n = 294; day 6 post-lesion no stimulation: n = 6; brain control: n = 12; day 14: no stimulation: n = 39; brain control: n = 93. Q3: pre-lesion n = 185; day 16 post-injury no stimulation: n = 98; brain control: n = 31). ***,** p<0.001 and p<0.01, respectively. Wilcoxon rank sum test. Error bars, s.e.m. (c) Bar plots reporting the capacity of the monkeys to sustain walking at the imposed treadmill belt speed. The functional score is computed as the percentage of regular steps in which the animal is able to walk at the treadmill belt speed i.e. animal does not bump into the back of the treadmill. Gait cycles classified as hops or stumbling were not included. ***,* p<0.001 and p<0.05, respectively, Bootstrap. Error bars, s.e.m. (d) Decoding accuracy increases during recovery after the spinal cord lesion. Decoder confusion matrices calculated reporting the accuracy of the real-time decoders and chance level decoder during brain-controlled stimulation for monkey Q2 at day 6 (n = 76 foot strikes, n = 74 foot offs) and day 14 post-injury (n = 264 foot strikes, n = 264 foot offs) and for monkey Q3 at 16 days post-injury (n = 319 foot strikes, n = 321 foot offs). The tolerance window was set at ± 125ms. The bar plots report the normalized mutual information calculated for the real-time decoders compared to random decoders and chance level decoders. (e) Top, from left to right: mean event rate, modulation depth and preferred direction for the neuronal spiking signal recorded obtained by regressing spike rates against the phase of the gait cycle for monkeys Q1-3. Preferred direction was defined as the angle for which the fitted tuning function was at a maximum. Bottom, from left to right: mean absolute single-electrode difference for mean event rates, modulation depths and preferred directions between two consecutive sessions shown in (e) top. Analysis shows substantial changes both before and after the spinal-cord lesion. Nevertheless, the rate of change between the last pre-lesion and the first post-lesion sessions was substantially higher than between any two other session pairs, thus indicating increased level of plasticity following spinal cord lesion. ***,** significant difference at p < 0.001 and p < 0.01, respectively. Monte Carlo, Wilcoxon ranksum test, signed Wilcoxon ranksum test and Bootstrap. Error bars, s.e.m.

